Stocks are likely to correct further before marking a real bottom, but with risk currently high for ETFs that track popular safe havens like the dollar and Treasuries, better entry points could be ahead.
The yield on the ten-year Treasury note plunged on Wednesday to the lowest level since 1945, closing at 1.62%. The completion of the weekly flag formation has initial Fibonacci targets in the 1.5% area. The flight into the Treasury market has boosted the dollar and caused heavier selling in the euro.
The PowerShares DB US Dollar Index Bullish Fund (UUP) has had a good month, gaining well over 5%, and is now approaching its highest level since late 2010. The EUR/USD cross has dropped from 1.328 to a low of 1.235 on Wednesday. This is a decline of 7%, which is a huge move in the foreign exchange market.
Wednesday’s weak close in the stock market looked pretty bad, and typically would suggest a drop back to the May 18 lows. Another weak close on Thursday would support this view, but does this mean that now is the time to be buying the dollar or bonds, or shorting the stock market?
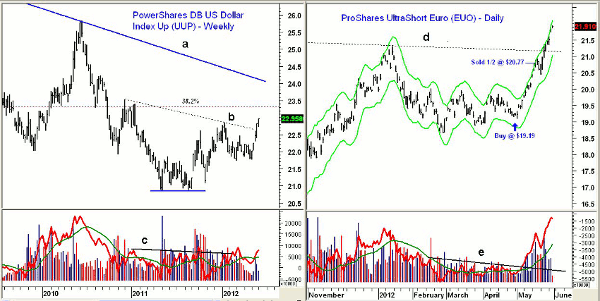
Chart Analysis: The PowerShares DB US Dollar Index Bullish Fund (UUP) looks ready to close the week above the downtrend, line b.
- The major 38.2% Fibonacci retracement resistance from the 2008 high of $27.19 is at $23.30. This is about 1.4% above Thursday’s close
- The long-term downtrend, line a, is now in the $24 area
- Weekly on-balance volume (OBV) broke briefly above resistance, line c, in early 2012 before turning lower
- OBV is back above its weighted moving average (WMA) but still below the early-2012 highs
- There is initial support now at $22.40-$22.50 with more important support in the $21.80-$22 area
The ProShares UltraShort Euro (EUO) has accelerated to the upside over the past seven days, rising from $20.44 to $21.97, which is a gain of 7.5%.
- The major resistance, line d, which goes back to late 2010, has been overcome
- EUO closed Wednesday above both the daily and weekly Starc+ bands, indicating that the fund is now in a high-risk buy area
- The major 61.8% Fibonacci retracement resistance from the 2010 highs is at $22.50
- Daily OBV broke through resistance, line e, in early May and has been acting much stronger than prices
- Weekly OBV (not shown) has confirmed the new highs
- First good support is now in the $20.44-$20.80 area
NEXT: Latest Outlook for Popular Bond and Stock Index ETFs
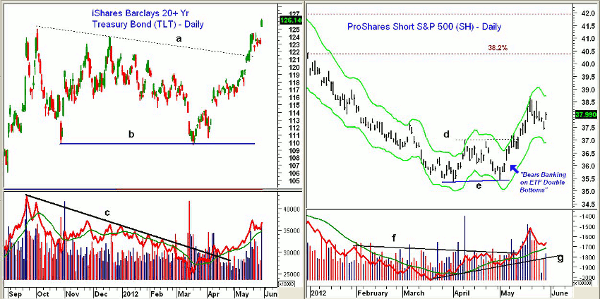
|pagebreak|As stocks moved sharply higher in March, the iShares Barclays 20+ Year Treasury Bond Fund (TLT) was retesting major support in the $110 area, line b.
- By early April, TLT was back to resistance in the $117-$118 area, but one bond indicator used by pro traders indicated that bond buyers were negative on stocks
- TLT gapped higher on May 11 and two days later completed the bull flag formation, lines a and b, that was evident on the daily chart
- The completion of the flag formation has a 127.2% Fibonacci retracement target at $129.20 with further targets at $132-$134
- Daily OBV moved through its eight-month downtrend, line c, in early April
- It continues to act strong, and volume was heavy on Wednesday
- There is initial support now at $124.60-$123.80 with the rising 20-day exponential moving average (EMA) now at $121.66
The daily chart of the ProShares Short S&P 500 ETF (SH) shows that the double bottom was completed on May 14 with the daily close well above the April 10 high at $37.02.
- The initial upside target at $38.65 was hit last week when the high was $38.70
- Daily Starc+ band is now at $38.72 with the weekly Starc+ band at $39.50
- Major 38.2% Fibonacci retracement resistance is at $40.35
- Major 50% resistance is at $41.90. SH traded as high as $42.37 last December
- OBV moved through its resistance, line f, and lead the price breakout by three days
- OBV held above its weighted moving average on the pullback and is now trying to turn higher
- There is initial support in the $37.40-$37.14 area
What It Means: As I noted last week, the next major downside targets for the primary stock index ETFs are likely to be met before a short-term bottom can be completed.
At this point, I am not looking for a waterfall decline from current levels, and so far, the futures are holding up in early-Thursday trading. It is possible that the rally is not over, and a close in the Spyder Trust (SPY) above $133.70 would signal a rally to the $135.50-$136 area.
I would not be adding to either long dollar or long bond positions right now because the risk cannot be well controlled. In case we do see a more severe decline, then I expect to stay with the existing position in the ProShares Short S&P 500 ETF (SH) until there are clear signs that the stock market has bottomed.
If stocks do rebound further, there may be better entry points in all of these markets.
Portfolio Update
- Buyers should be long the PowerShares DB US Dollar Index Bullish Fund (UUP) from $21.98 or better. Use a stop at $22.14
- Those who bought the ProShares UltraShort Euro (EUO) at $19.19 or better are now out. Half the position was sold on May 18 at $20.77, and the other half was sold at $21.77 yesterday
- For the iShares Barclays 20+ Year Treasury Bond Fund (TLT), buyers should have gone 50% long at $118.06 and 50% long at $117.44. Half the position was sold at $123.74 or better. Use a stop at $121.92 on the remaining position
- Buyers should be 50% long the ProShares Short S&P 500 ETF (SH) at $36.26 and 50% long at $36.06 with a stop at $36.88. Cancel the order to sell half the position at $38.86 or better


