Beaten-down fertilizer stocks may appear to be good value plays, but bearish seasonal patterns and still-negative technical studies could cause new buyers to get buried.
Tuesday’s late rally in the stock market likely spooked some on the short side after the early break of the two-day lows had given them some encouragement. The latest analysis of the Advance/Decline (A/D) lines does not yet suggest an important low is in place, but that could change before the end of the week.
While a majority of analysts on the popular financial stations seems to be bearish, those looking for stocks to buy may be enticed by beaten-down fertilizer stocks like Potash Corporation of Saskatchewan (POT) or Mosaic Company (MOS).
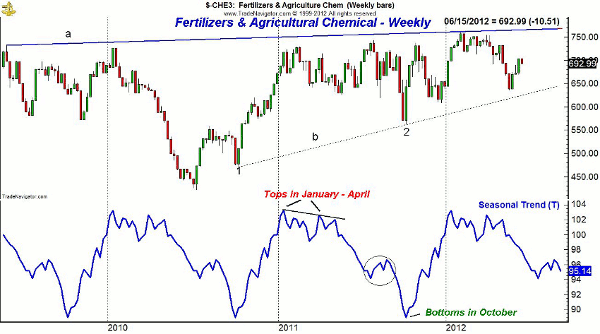
The seasonal trend analysis shows that historically, investors would be wise to wait until later in the year when the fertilizer group typically bottoms. I have found the seasonal trend analysis to be the most powerful when it confirms the volume and relative performance analysis.
See also: The 4 Key Seasonal Trends for 2012
Chart Analysis: The index of Fertilizer and Agricultural Chemical stocks has rallied over the past month and has come close to the weekly uptrend now in the 620-630 area.
- The weekly chart shows that there is multi-year resistance, line a, in the 750 area, which is about 10% above current levels
- Seasonal analysis indicates that after a peak in January, this industry group typically forms a secondary peak in April
- The decline generally lasts until October, but of course, there are variations. In 2010, the index formed a higher low in October, point 1
- In 2011, the low in price (point 2) coincided nicely with the seasonal low
- The short-term pattern indicates that the group does often bounce in the summer months (see circle)
NEXT: Charts for Potash, Mosaic Show Further Warning Signs
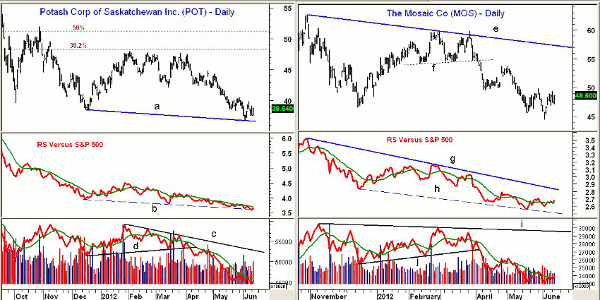
|pagebreak|Potash Corporation of Saskatchewan (POT) rebounded early in the year but failed below the 38.2% retracement resistance at $48.35, which was calculated from the 2011 high at $63.96.
- POT had a low last week of $36.73 but is holding the $37.40-$37.60 short-term support zone so far this week
- The daily chart shows a pattern of lower lows
- Relative performance, or RS analysis, has also made lower lows, line b, and shows no signs yet of bottoming
- Daily on-balance volume (OBV) broke support, line d, in early April, and this move preceded the price break
- Daily OBV has continued to make new lows, but the weekly OBV (not shown) has not yet confirmed the new lows
- Next resistance is in the $39.85-$40.49 area and a close above this zone will complete a short-term bottom
Mosaic Company (MOS) made a high of $59.75 at the end of February and then had an intraday high of $59.80 in March, although it did not make a new closing high.
- MOS made a high of $89.24 in February 2011
- The daily top formation was completed on April 3 when support, line f, was violated
- MOS made a low of $44.23 last week and has bounced back to initial resistance in the $49.38-$49.83 area
- More formidable resistance is in the $53.50 area
- Relative performance shows a well-established downward trading channel, lines g and h. It did not make a new low last week
- OBV confirmed the price action by breaking support, line j, in early April
- Daily OBV made new lows last week and the weekly OBV (not shown) is still below its weighted moving average (WMA)
- Minor price support is now at $46.80, and if broken, it should signal at least a test of the lows
What It Means: The daily chart formations in both POT and MOS suggest these stocks could be bottoming on a short-term basis. While volume did pick up in POT on Tuesday, the daily studies are still negative. Both stocks are among the ten largest holdings of the Market Vectors Agribusiness ETF (MOO).
The seasonal trend analysis indicates that typically, a summer rally in the fertilizer stocks does not last too long and is generally followed by a further decline.
How to Profit: Until the technical studies turn more positive, I would recommend looking elsewhere for short-term trading prospects.


