
Stocks remain choppy as bulls and bears fight for the upper hand, but bond market pros are sending the same message as in April, which presents an opportunity in a popular Treasury ETF.
In early May, I discussed the NOB spread, which is followed by many bond market pros. I noted that as stocks were peaking in early April, bond traders were buying bonds and shorting ten-year Treasury notes, expecting rates to drop as investors moved out of stocks and into the safety of the Treasury market.
The rationale was that yields on the T- bonds would fall more than those on T-notes, thus causing the NOB spread to widen and giving a profit to those buying the spread. This created a good buying opportunity in bond ETFs like the iShares Barclays 20+ Year Treasury Bond Fund (TLT).
My analysis of T-bond yields at that time indicated that a drop in yields below 2.875% would “project a drop to the 2.20%-2.30% range, which would imply a very weak economy.” After the yield closed Wednesday at 2.71%, what are bond buyers doing now?
Click to Enlarge
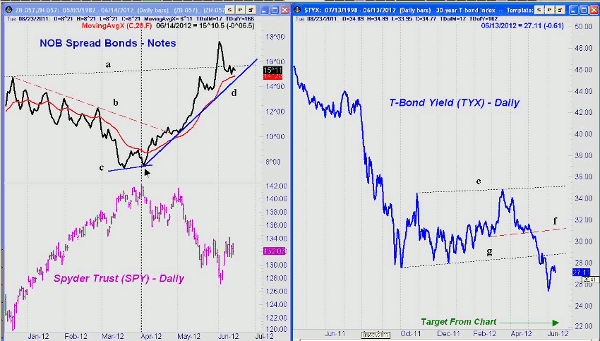
Chart Analysis: The current chart of the NOB spread shows that it spiked to a high on June 1 before reversing course. The spread has doubled since early April.
- The spread is holding above its 20-day exponential moving average (EMA) and the uptrend, line d
- The spread formed higher lows in early April, line c, when the Spyder Trust (SPY) was making higher highs
- This bottoming formation was confirmed by the move in the spread through its downtrend, line b
- If SPY should drop back to or below the lows at $127.14, the NOB spread could form lower highs, which would be consistent with a bottom in stocks
- A break in the NOB spread below the mid-May lows will suggest the spread has topped out
The daily chart of Treasury bond yields ($TYX) shows that support, line f, was broken on May 8. This was followed by a May 17 decline below the stronger support, line g, in the 2.86% area.
- The 127.2% Fibonacci retracement target from the continuation pattern at 2.53% was hit on June 4
- Completion of this pattern has additional downside targets in the 2.23% area
- There is strong resistance in terms of yield in the 2.80-2.90% area
NEXT: Bond ETFs for Hedging Long Stock Positions
|pagebreak|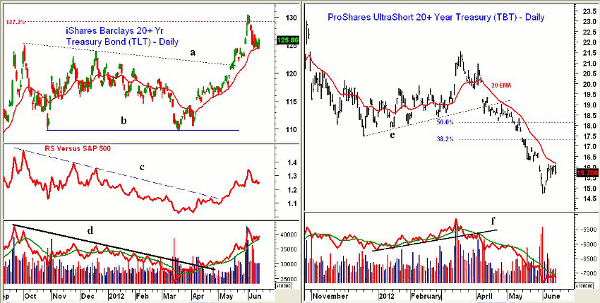
Click to Enlarge
The iShares Barclays 20+ Year Treasury Bond Fund (TLT) broke through its downtrend, line a, on May 15 and accelerated to the upside. TLT hit a high of $130.38 on May 31.
- The recent pullback has taken TLT back to support in the $124.40 area and the flat 20-day EMA
- Further support is at $122.60, which is the 38.2% Fibonacci retracement support level
- Relative performance, or RS analysis, bottomed on May 7 when the downtrend, line c, was broken. It is still positive
- On-balance volume (OBV) bottomed in April when it moved through resistance from late 2011, line d
- OBV confirmed the recent highs and is holding above its rising weighted moving average (WMA)
- Weekly OBV (not shown) is also positive and is well above its weighted moving average
- Using the correction from the highs, the 127.2% Fibonacci target is just above $132
The ProShares UltraShort 20+ Year Treasury ETF (TBT) is a double inverse of TLT. The fund broke support, line e, on April 10 and then retested the breakdown level at the end of the month before collapsing.
- TBT has bounced back over the past week, reaching the declining 20-day EMA at $16.25, although it shows no signs yet of bottoming
- The 38.2% retracement resistance is at $17.30
- Daily OBV broke its support, line f, in March and lead prices on the downside
- There is minor support now at $15.34-$15.40 that, if broken, could signal that the rebound is over
What It Means: My in-depth technical appraisal of the stock market suggests that the market is in the process of bottoming. However, it looks as though bond traders are still negative and looking for a drop back to or below the recent lows.
A short-term trade in TLT could be used to hedge some of exposure to the stock market.
How to Profit: Aggressive traders should buy the iShares Barclays 20+ Year Treasury Bond Fund (TLT) at $125.66 or better with a stop at $121.93 (risk of approx. 3%). Cancel the order if $127.10 is hit first. Sell half the position at $129.76 or better.
Portfolio Update: Buyers should be 50% long TLT from May 10 at $117.93 with a stop at $121.92. Half the position was sold at $124.73.


