
Traders and investors looking for selective opportunities in the current markets can look to these tech stocks, which are trading near low-risk buy levels from which rallies are more likely.
Last week’s market strength carried over in early futures trading, but the market then cast its own vote on the Greek election and the futures have reversed to the downside. At the early-June lows (see chart), both the short-term Advance/Decline (A/D) indicators like the McClellan Oscillator as well as the NYSE A/D line did not make new lows. These positive divergences suggested that fewer sellers were pushing stocks lower than was the case in the middle of May.
The market internals, however, are not yet signaling that a major new uptrend is underway, so further choppy action is likely over the next week or so. As a result, days when the markets are down should create some good buying opportunities in select stocks.
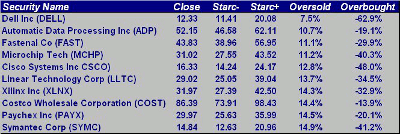
Therefore, I wanted to see which of the Nasdaq 100 stocks were currently closest to their monthly Starc- bands. That is one way to identify whether a stock is in a high- or low-risk buy area. Close proximity to the upper Starc band (Starc+) means it is a high-risk time to buy since the stock is likely to at least move sideways, if not decline. Conversely, when a stock closes near its lower Starc band (Starc-), it is a high-risk time to sell since the chances of a rebound are high.
For more on trading with Starc bands, click here.
Click to Enlarge
The scan results reveal the ten Nasdaq 100 stocks that are closest to their monthly Starc- bands. I then took a close look at the top ten stocks to determine if any were close to monthly support and also whether their volume patterns revealed any signs of accumulation.
Three of the stocks that I will focus on today have reached important support, while Dell Inc. (DELL) is the closest to its monthly Starc- band but is still acting weak despite the recent dividend news.
Click to Enlarge
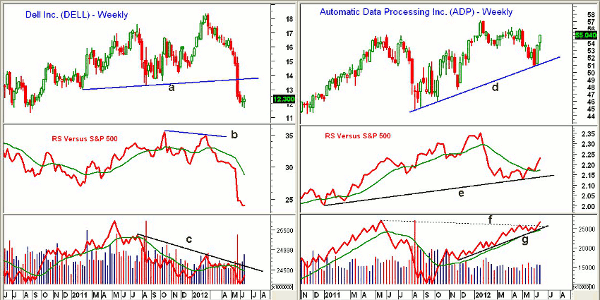
Chart Analysis: Dell Inc. (DELL) has had a rough 2012 and is down over 12%. It was crushed in late May, dropping from $14.74 to $12.46 in just one week and breaking long-term support at line a.
- Next long-term support from 2010 is in the $11.38 area
- Relative performance, or RS analysis, formed lower highs in early 2012, line b, which was a sign of weakness
- The RS line dropped below its weighted moving average (WMA) in March, suggesting that DELL was weaker than the S&P 500. It still looks very weak
- Weekly on-balance volume (OBV) also formed a negative divergence at the February highs, line c, and has formed lower lows
- There is now a barrier of strong resistance in the $13-$13.60 area with the 38.2% retracement resistance at $14.25
Automatic Data Processing Inc. (ADP) is a $26.9 billion provider of business software and services. The stock currently yields 2.9%, and price has rallied sharply over the past two weeks after testing its weekly uptrend, line d. It is now up over 8% from the lows.
- Next strong resistance is in the $56-$57 area with further resistance above $58
- Relative performance reached stronger support (line e) in April and then moved back above its weighted moving average
- Weekly OBV has just broken through major resistance at line f
- OBV is above its weighted moving average and the uptrend, line g
- There is initial support now at $53.80-$54.40 with much stronger support in the $52.50-$53 area
NEXT: High-Yielding Chip Stock That Could Be a Good Buy
|pagebreak|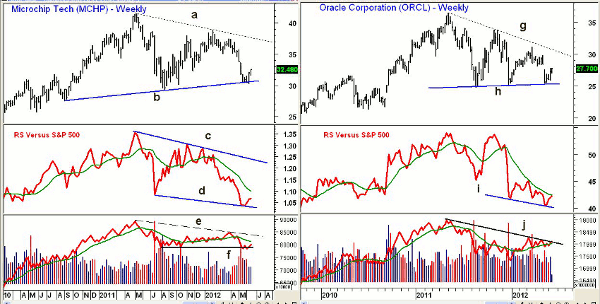
Click to Enlarge
Microchip Tech (MCHP) is a $6.29 billion specialized semiconductor company that currently yields 4.3%. Two weeks ago, MCHP tested long-term support, line b, in the $30-$30.50 area.
- There is next resistance in the $35 area with the weekly downtrend, line a, at $37.60
- RS analysis shows a pattern of lower highs and lower lows, lines c and d
- The RS line needs to move back above its weighted moving average to signal that it is starting to outperform the S&P 500
- Daily RS analysis appears to have bottomed
- Weekly OBV looks better and has turned up from good support at line f
- OBV is below its weighted moving average and the downtrend, line e
Oracle Corporation (ORCL) is a $137.8 billion application software giant whose stock has retested important support in the $25 area, line h, a support level that goes back to 2011.
- The weekly downtrend, line g, is at $30.70, and a close above $31.20 would complete the flag formation (lines g and h)
- RS line has turned up but is still below its declining weighted moving average
- RS line did form lower lows, line i
- Weekly OBV does look better and is testing its downtrend, line j, while it is also above its weighted moving average. It also shows a pattern of higher lows
- Initial support is in the $26-$26.50 area
What It Means: Isolating stocks that are closest to their monthly Starc- bands can give us a jump on which will be the most oversold at the end of the month. Automatic Data Processing Inc. (ADP) shows the best monthly volume pattern, but it would need quite a setback to become an attractive buy.
Though the weekly RS analysis on Microchip Tech (MCHP) is still weak, I do like the prospects for the semiconductor sector, as well as this stock’s very attractive yield.
How to Profit: For Automatic Data Processing Inc. (ADP), go 50% long at $53.88 and 50% long at $53.32 with a stop at $50.38 (risk of approx 6%). Cancel the order if $55.88 is hit first.
For Microchip Tech (MCHP), go 50% long at $32.08 and 50% long at $31.44 with a stop at $29.82 (risk of approx 6.1%).
NEXT: See the Current “Charts in Play” Portfolio
|pagebreak|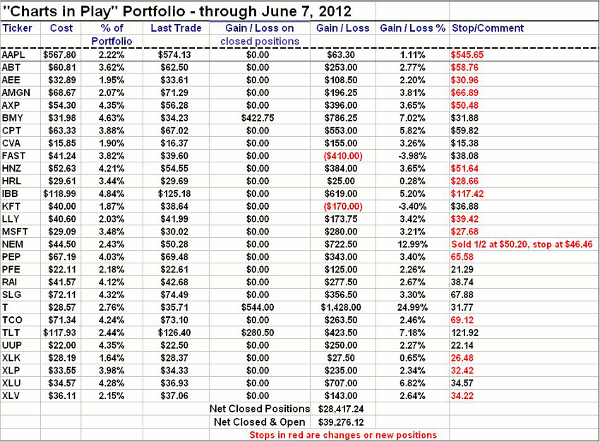
Click to Enlarge


