A number of coal names made impressive rebounds this week, but is it a fluke or do the charts confirm a new uptrend?
The improvement in the technical outlook for stocks has caused many of the weakest sectors to rally sharply as bargain hunters scoop them up. The markets are trading in a quiet fashion ahead of the June employment data.
Even though the intermediate outlook has improved sharply, picking the right sectors or stocks in the right sectors I feel is still a critical step. Relative performance, or RS analysis plays an important role in this process, as it will often separate outperforming sectors from the ones that are just rebounding within their major downtrends.
The coal stocks have had a nice move recently, as Peabody Energy (BTU) is up over 26% from last week’s lows, while Arch Coal (ACI) has done even better, up over 34%. So should this sector or these stocks be on your buy list?
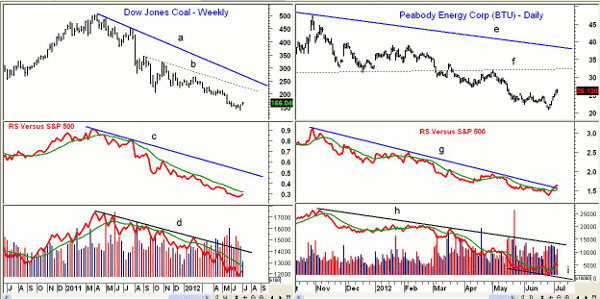
Chart Analysis: The weekly chart of the Dow Jones Coal Index shows that it peaked at 504.66 in April 2011 and had a low of 137.44 last week. This is a drop of almost 73%.
- There is next strong resistance stands in the 200 area, with the initial weekly downtrend (line b) now at 225
- The longer-term downtrend is much higher, at 274
- The RS analysis peaked over a year ago, and is in a well-established downtrend (line c). It is still well below its declining WMA
- Volume has been declining over the past six weeks, and the weekly on-balance volume (OBV) has formed lower lows
- The OBV formed a negative divergence at the 2011 highs (line d), and this resistance needs to be overcome to signal that an important low is in place
Peabody Energy (BTU) traded as high as $47.81 last October but dropped to a low of $20.67 just last week. The recent rally has taken BTU to its highest level since May 14.
- There is next resistance from the April lows in the $27 area, with much stronger levels in the $32 area (line f)
- The longer-term downtrend on the daily chart (line e) is now at $38.40
- The eight-month downtrend in the relative performance (line g) was broken this week. It has not yet started a new uptrend, as it must move above the April highs
- The daily OBV looks even weaker: while it is now above its WMA, it is well below its downtrend (line h)
- It is also a sign of weakness that the OBV made lower lows (line i)
- There is short-term support now at $24.40 to $25, with stronger levels at $23.60
NEXT: Using Hourly Charts to Spot Contra-Trend Rallies
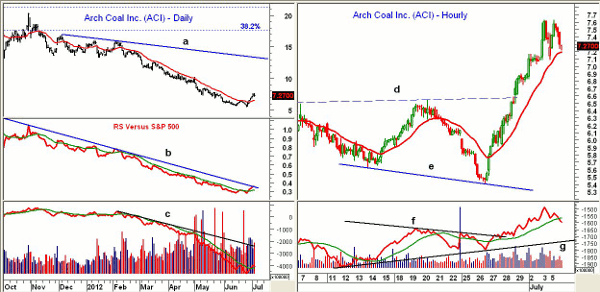
|pagebreak|Arch Coal (ACI) traded as low as $5.41 on June 26, which was slightly below the previous low of $5.62. ACI hit $7.63 in Thursday’s session.
- On the daily chart, you will notice that prices are now above the 20-day EMA, which had contained the price action for the past few months
- There is further resistance in the $10 area, with the daily downtrend (line a) following at $13
- The 38.2% Fibonacci retracement resistance from the March 2011 high at $36.99 stands at $17.62
- The relative performance is just testing its daily downtrend (line b), and shows a clear pattern of lower lows and lower highs
- There was heavy selling in May, and the OBV is well below its major downtrend (line c)
- The OBV is slightly above its WMA, but is acting weaker than prices, and did confirm the recent lows
The hourly chart of Arch Coal (ACI) shows the lower lows in June (line e), and then the move above the swing high at $6.56 (line d) on June 29.
- The hourly OBV formed a bullish divergence on June 26 as it made higher lows (line g)
- The OBV moved through its resistance (line f) early on June 28, confirming the bullish divergence
- The hourly OBV looked a bit toppy with Thursday’s close, as it dropped below its WMA
- Prices held above the rising 20-hour EMA just after the lows, and could have been used as an initial stop once OBV bottomed
What it Means: Even though the recent rally in the coal stocks has been impressive, there are no signs based on either the relative performance or OBV analysis that a low is in place. I would look for some bullish divergences in the daily OBV before a bottom can be completed.
Short-term traders will find that on liquid stocks or ETFs, the OBV with a 21-period WMA can be a very useful timing tool. Of course, I would recommend that you always have a stop in place and scale out of long positions if they go in your favor.
How to Profit: No new recommendations for now.


