
What do the technical readings suggest as to how imminent earnings reports may impact the prices of these four widely watched consumer discretionary stocks? MoneyShow's Tom Aspray takes a look.
This week, we are still getting second-quarter earnings reports, and there are a few widely watched consumer discretionary stocks that are scheduled to report. As I noted yesterday, this sector has been one of the top-performing sectors so far this year.
The importance of consumer spending to the economy can not be ignored. The retail sales data for June, reported on July 16, missed estimates. The report for July comes out next week (August 14) and will be widely watched.
However, same-store sales data reported last week was encouraging. Both Gap (GPS) and Macy’s (M) topped analysts' estimates.
Typically, many of the retail stocks bottom in August and September, then rally into the Christmas season. Still, earnings are watched closely, and as I noted in April, “Technical tools like Fibonacci, relative performance, and on-balance volume analysis can often fire early warning signals and keep stock investors safe from earnings-inspired meltdowns.”
Let’s look at the technical outlook for these stocks as they face earnings this week.
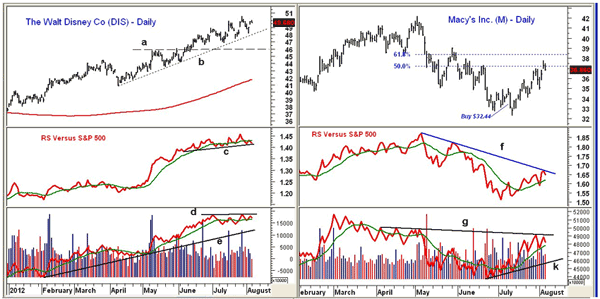
Click to Enlarge
Chart Analysis: Walt Disney (DIS) has done extremely well in 2012, as it is up over 32%, which clearly makes it a market leader. In May, DIS closed above 12-year resistance at $44.81, which was very significant. DIS reports its earnings after the close Tuesday, August 7.
- The next long-term targets are in the $58 to $60 area, and in late July it made a new 52-week high of $50.54.
- The daily relative performance did confirm the recent highs, but has been in a narrow range for the past few months, with short-term support at line c.
- The daily on-balance volume (OBV) has not made new highs since late June, and a drop below the recent lows is likely to signal a correction.
- The OBV has stronger support at line e.
- Both the weekly RS and OBV analysis (not shown) look much stronger.
- There is first support in the $47.40 to $48 area (line b), with stronger levels at $45.80 (line a).
- DIS is almost 20% above its sharply rising 200-day MA, sitting at $41.60, which is a sign it is overbought.
Macy’s (M) had a low of $32.31 on July 12, and last Friday surpassed the 50% Fibonacci retracement resistance at $37.20. Macy’s reports earnings on Wednesday, August 8.
- The 61.8% retracement resistance is at $38.35, with weekly chart resistance now at $39.60 to $41.
- The daily relative performance moved above its WMA four days after the lows, and has now reached the downtrend (line f).
- The weekly RS line (not shown) has just reached its declining WMA.
- The daily OBV did not made new highs last week, having reached strong resistance (line g).
- The OBV has first support at the uptrend (line k).
- There is initial support now at $36 to $36.30, followed by stronger levels at $35.
NEXT: Which of These Two Retail Names Looks Stronger?
|pagebreak|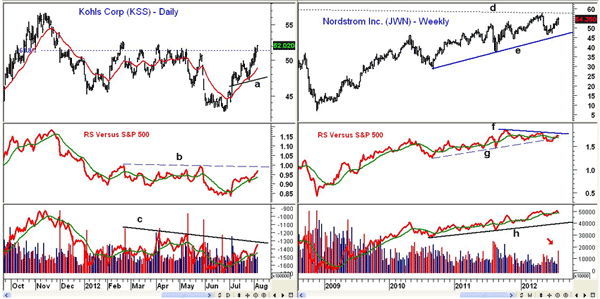
Click to Enlarge
Kohl's (KSS) closed Monday above $51.30, which was the 61.8% Fibonacci retracement resistance from the November 2011 high of $56.66. They report earnings on Thursday, August 9.
- There is additional resistance from February at $62.68.
- The daily relative performance is in a short-term uptrend, and above its WMA. There is more important resistance at line b.
- The daily OBV is rising, but not far below key resistance at line c.
- The weekly RS and OBV lines are above their WMAs, but below the previous peaks.
- There is first support now at $50 to $50.60, then in the $48 area.
Nordstrom (JWN) has rallied sharply from the early June lows at $46.27, but is still well below the May highs at $57.75 (line d). This resistance was derived from the 2007 high of $59.70. Nordstrom reports earnings on Thursday, August 9.
- The weekly RS analysis did not confirm the highs in 2012, and is below the resistance at line h.
- The RS line broke its uptrend (line g) in early June, but is now back above its WMA
- The weekly OBV did make new highs two weeks ago, and is well above long-term support at line h.
- Volume last week (August 1) was quite heavy as JWN closed lower.
- There is first support at $52 to $52.50, with stronger levels now at $49 to $50.50
What it Means: Risk management is an important part of all investing and trading. I have always felt that establishing new positions ahead of an earnings report increases the risk dramatically.
Since last March, I have been attempting to buy DIS, as its long-term outlook is quite positive. Currently it is quite overextended, and I would look to buy on a significant correction.
Our long positions in Macy’s (M) were established very close to the recent lows, and are up over 13% in less than a month. The daily technical action makes a pullback likely, so I recommend taking profits on half of the position.
Of the other two retailers, Kohl's (KSS) looks more vulnerable than Nordstrom (JWN). I would only look to buy either one on a very significant pullback.
How to Profit. Investors should be 50% long Macy’s (M) at $32.44. Sell half the position now, and use a stop at $32.23 on the remaining position.


