One technology industry group has performed nicely over the past few weeks, but warning signs suggest that its leading ETF and several of its stocks are now more vulnerable...so MoneyShow’s Tom Aspray recommends new action.
The S&P 500’s close above the widely watched 1,400 level has forced some of the perpetual bears off the sidelines, but the market internals are still acting weaker than prices.
The S&P 500 A/D line is still below the highs that were made both in early and mid-July. This suggests fewer stocks are pushing the market higher.
This internal weakness, combined with the fact that many of the major averages have now reached more important resistance, makes the stock market more vulnerable to a correction. The futures are down in early trading, and a close under Monday’s lows could complete a short-term top.
In July, I discussed the sharp increase in short interest in the Market Vectors Semiconductor ETF (SMH). This increased the chances that short sellers in semiconductor stocks would get squeezed.
Now that this ETF is up over 12% from the July lows, what strategy is best now?
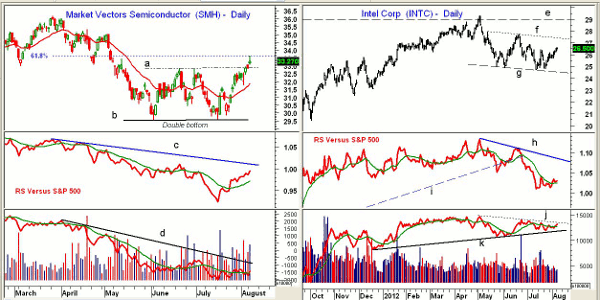
Chart Analysis: The daily chart in July suggested a double bottom could be forming in the Market Vectors Semiconductor ETF (SMH).
- SMH has just reached the 61.8% Fibonacci retracement resistance, as calculated from the March high of $36.17.
- The rally above resistance at $32.80 (line a) completed the double-bottom formation, with upside targets in the $35.80 to $36.50 area.
- The daily relative performance has rallied above its WMA, but is still well below longer-term resistance at line c.
- The volume action on the recent rally has not been impressive, as the on-balance volume (OBV) is still in a downtrend and below strong resistance (line d).
- There is first support at $31.75 to $32, with stronger levels at $31.
Intel (INTC) has had a much weaker rally from the July lows, as it is still below the June high at $26.86. There is further resistance at $27.40 (line f).
- There is major resistance from 2005 in the $29 area (line f).
- INTC has been keeping place with the overall market, but not leading it, as the RS line has not improved much in the past few weeks. It is well below resistance (line h).
- The longer-term uptrend in the relative performance (line i) was broken in May.
- The daily OBV is holding above support (line k), and is just barely above its WMA.
- The OBV needs a strong move above resistance (line j) to signal a stronger rally.
- There is first good support at $25.75, and then at $24.68 to $24.79.
- INTC has an attractive yield of 3.4%.
NEXT: Should You Sell This Chipmaker Before Earnings?
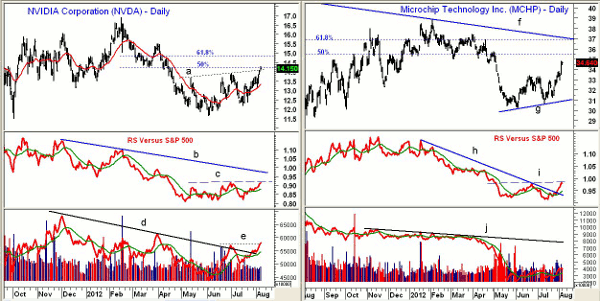
|pagebreak|NVIDIA (NVDA) closed Tuesday just below the resistance in the $14.10 area (line a). NVDA reports earnings on Thursday, August 9.
- The 50% Fibonacci retracement resistance is at $14.25, with the 61.8% resistance at $14.81.
- The relative performance is above its WMA, but still below the resistance (line c), which needs to be overcome to confirm a bottom.
- The RS analysis has further resistance at the downtrend (line b).
- The OBV rallied sharply in late June and early July,. but has not yet made new highs, with resistance at line e.
- The longer-term downtrend in the OBV (line d) was broken over a month ago.
- There is first support now at $13 to $13.30.
Microchip Technology (MCHP) has rallied sharply from the July 11 low of $31.03, and has overcome the 38.2% Fibonacci retracement resistance, wit the 50% level next at $35.50.
- The long-term downtrend (line f) and the 61.8% resistance are in the $37 area.
- The relative performance broke its downtrend (line h) at the end of July, and is now testing further resistance (line i).
- A strong move above this level will signal that is now a market-leading stock.
- The OBV plunged in May, and has not recovered. While it is above its WMA, it is locked in a narrow range. Strong OBV resistance can be found at line j.
- There is minor support in the $38.20 to $34.20, with additional levels in the $32.50 area.
What it Means: Though semiconductor stocks have had a nice rally over the past several weeks, the technical action has not been as strong as I would like. The failure of both the OBV and the RS analysis to confirm an important low makes these stocks and this sector more vulnerable over the near term.
How to Profit: I would recommend lightening up our positions and taking some nice profits off the board. This is especially the case for NVIDIA (NVDA), given its earnings come out tomorrow.
Portfolio Update: Investors should be 50% long Market Vectors Semiconductor ETF (SMH) at $30.88 and 50% long at $30.46. Sell half now and use a stop at $30.52 on the remaining position.
For Intel (INTC) investors should now be 50% long at $25.71, as 50% was sold at $25.68. Use a stop at $24.73.
For Microchip Tech (MCHP), investors should be 50% long at $32.08 and 50% at $31.44. Sell half now and use a stop at $31.33 on the remaining position.
For NVIDIA (NVDA), investors should be 50% long at $12.64 and 50% long at $12.36. Sell half now and use a stop at $12.53 on the remaining position.


