These four well-known stocks were hit last quarter by weakness in emerging markets, but technical analysis points to upcoming potential for a couple of them. MoneyShow's Tom Aspray shares the key levels to watch.
The third-quarter gains in the index-tracking ETFs have beaten most expectations. At the start of the quarter, investors were still wondering whether they should have bought in May, or if the markets would plunge again like they did in August 2011.
Tech stocks led the way in the third quarter, as the PowerShares QQQ Trust (QQQ) gained 6.7%, followed by a 6% gain in the Spyder Trust (SPY). The iShares Russell 2000 Index Fund (IWM) finished strong, but was up just 5.2%, while the SPDR Diamond Trust (DIA) lagged, "only" rising 4.9%.
Investors who focused on large companies that earn a significant percentage of their revenue from emerging markets have been disappointed. Typically, when the US market is strong, these stocks do even better, but this has not been the case over the past few months.
These four top-flight companies have lagged the S&P 500 by 2% to 8% in the past quarter, and investors want to know if this will continue. Relative performance analysis did alert investors that these stocks were going to underperform the S&P 500 over the past few months...but what’s next?
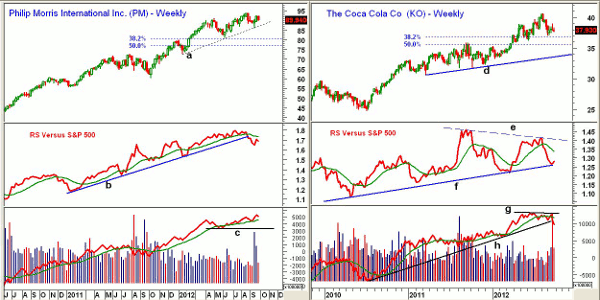
Chart Analysis: Philip Morris International (PM) reported in July that its second-quarter revenue declined 4%, due in part to the stronger dollar. Their next earnings report is on October 18. The current yield is 3.8%.
- PM is down 3.8% from the August high of $93.50, while SPY is 1% above its August high.
- The weekly chart shows that the uptrend (line a) is now at $87.35, with the recent low at $86.11.
- The 38.2% Fibonacci retracement support from the 2011 lows is at $80.90, with the 50% support at $77.
- The relative performance dropped below its WMA a week after PM made its highs, and the uptrend (line b) was also broken.
- The weekly RS line is now in a downtrend, but it did confirm the most recent high. The monthly analysis does look much stronger, which is positive for the long term.
- The weekly on-balance volume (OBV) is acting stronger than prices, as it just made new highs and is well above its WMA. Key OBV support now sits at line c.
- There is key weekly resistance at $93.30 to $93.60. If it is overcome, the correction is likely over.
Coca-Cola (KO) also reported lower second-quarter earnings, as gains from overseas growth were offset by higher commodity prices. KO reports earnings on October 16, and currently yields 2.7%.
- KO peaked in early August at $40.66, and has dropped 6.7% from the highs.
- The low in early September was at $37.11, which was just above the 38.2% Fibonacci retracement support from the 2011 lows.
- The 50% retracement support is at $35.67, and it corresponds nicely to the September 2011 highs.
- There is stronger trend line support in the $33.70 area (line d).
- The weekly relative performance formed lower highs (line e) and then dropped below its WMA.
- The RS line is now testing long-term support at line f.
- The monthly RS Analysis (not shown) also did not confirm the recent highs, but is in a clear uptrend.
- Volume was very heavy two weeks ago, which dropped the OBV below its WMA and the uptrend (line h).
- There is initial resistance now at $39, with further at $39.69.
NEXT: Which of These Stocks Are Worth Buying?
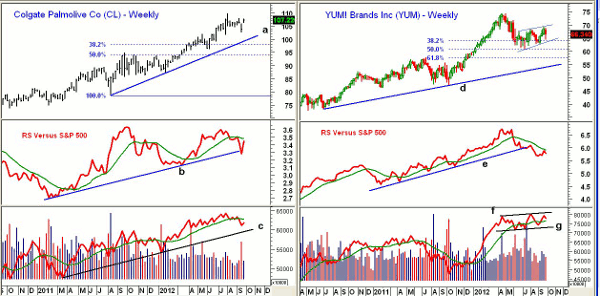
|pagebreak|Colgate-Palmolive (CL) reported a slight increase in second-quarter income. It next reports its earnings on October 25. Both the Select Sector SPDR Consumer Staples (XLP) and CL gained about 3.7% in the third quarter, well below that of the S&P 500.
- CL has rebounded sharply from the recent low at $102.50 and has stronger support at $101.50.
- The weekly uptrend (line a) is now at $99.50, with the 38.2% retracement support at $98.
- The relative performance reversed sharply after breaking its uptrend (line b) just two weeks ago.
- The RS line dropped below its WMA during the second week of August, which warned it was weaker than the S&P 500.
- The weekly OBV is also below its WMA, but it did confirm the recent highs.
- The OBV is well above its long-term uptrend (line c). The monthly OBV (not shown) does look much stronger.
- CL moved higher Monday, closing right at - short-term resistance in the $108 area. Short-term support now sits at $105.50 to $106.
Yum! Brands (YUM), the parent company of Taco Bell, KFC, and Pizza Hut, also reported disappointing earnings last July. Their next earnings are due out October 9. On September 20, the company raised its dividend by 18%, and it now yields 2%.
- YUM peaked in April at $74.44, and is currently trading 9.4% below the highs.
- The chart shows an apparent flag or continuation pattern (blue lines), with resistance at $69.25 and support at $62.75.
- The 50% Fibonacci retracement support from the 2011 lows, $60.70, was approached in July. The more important 61.8% support is at $57.48, corresponding closely to the July 2011 highs at $57.75.
- The RS analysis dropped below its WMA in early June, then violated support (line e). It is still well below its declining WMA.
- The monthly relative performance (not shown) did confirm the highs this year, but is also now below its WMA.
- The weekly OBV has held up well, and is still positive.
- On a move above $69.25, there is further resistance at $71.50.
What it Means: As I have written about extensively in the past, accurately predicting earnings or any fundamental data is very difficult, and I have found a technical approach can be better in warning of earnings misses.
For example, a recent Ernst & Young report estimated that over the next four years, there will be a $47 billion gap between what the major drug companies are expecting in emerging-market sales and what they ultimately will receive.
Of these four stocks, Coca-Cola (KO) and Yum! Brands (YUM) look the most interesting on a drop back toward their long-term breakout levels.
How to Profit: For Coca-Cola (KO), go 50% long at $37.26 and 50% long at $36.44, with a stop at $34.74 (risk of approx. 5.7%). Cancel if $39.88 is hit first.
For Yum! Brands (YUM), go 50% long at $61.58 and 50% long at $60.76, with a stop at $57.12 (risk of approx. 6.6%).


