
Strong auto and truck sales surprised many on Tuesday, helping support the stock market...but before buying, MoneyShow's Tom Aspray suggests you determine whether this is a leading or lagging sector.
Stocks on Tuesday maintained the tight ranges of the past week, and a close in the S&P either above 1,458 or below 1,430 will be important.
It may take the monthly jobs report on Friday to resolve the trading range, but for most, concentrating on individual stocks will be a better way to invest than the index-tracking ETFs.
The new truck and auto sales data Tuesday indicated the highest level of buying since February 2008, as Toyota and Honda sales surged 41% and 31% from over a year ago. They have continued to recover from 2011, when their production was sharply reduced because of the tsunami.
Both Chrysler and General Motors (GM) also reported healthy increases over last year, while Ford (F) reported slightly lower sales. Both Volkswagen and Hyundai did report double-digit gains. How does this sector look compared to the major averages, and should the auto stocks be on your buy list?
Click
to Enlarge
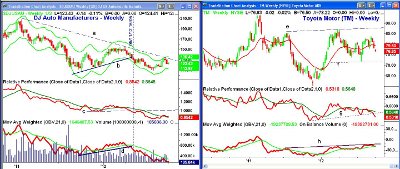
Chart Analysis: The weekly chart of the Dow Jones Auto Manufacturers Index shows a well-established downtrend (line a) from the 2011 highs. The weekly Starc+ band was tested two weeks ago, before prices reversed.
- The index is down 1.2% so far in 2012, and has underperformed the Spyder Trust (SPY) by over 16%.
- The next support sits in the 116 area.
- The weekly chart shows that the uptrend (line b) was broken on May 11. This preceded a 17.6% decline into the August lows.
- The relative performance or RS analysis shows a longer-term downtrend, as it has made lower lows and lower highs.
- The RS line broke support (line c) in early May, which was a strong warning.
- The on-balance volume (OBV) also broke its support (line d) a week ahead of prices, and it has continued to make new lows even while the index has been rallying.
- A rally above the September high at 133 is needed to improve the weekly chart.
Toyota (TM) has reversed sharply from the high three weeks ago of $83.74, but the weekly chart still shows a broad trading range (lines e and f).
- There is next support in the $74 area, with more important levels now at $72.04, which was the July low (line f).
- The relative performance peaked early in the year, but dropped below its WMA in April. Since then, the RS line has formed lower highs, and broke through support (line g) in late September.
- The OBV is now testing its WMA, but it has been holding up better than prices. The OBV has key resistance at line h.
- TM closed a bit lower Tuesday, despite the positive sales data, and there is strong resistance now in the $80 to $82 area.
NEXT: Are Any of These Auto Makers Good Buys?
|pagebreak|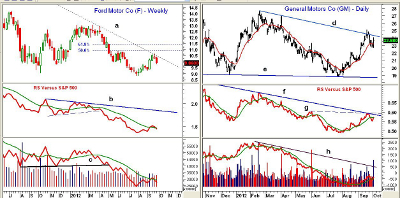
Click
to Enlarge
The long-term chart of Ford (F) shows a long-term downtrend, as it lost 36% in 2011 and is currently down over 9% in 2012. The downtrend that goes back to the 2011 high of $18.97 (line a) was tested two weeks ago.
- The rally from the summer lows at $8.82 has so far failed below the 50% Fibonacci retracement resistance at $10.95. The more important 61.8% resistance is at $11.45.
- The relative performance has been in a long-term downtrend since early 2011, which meant this stock should have been avoided.
- The weekly RS support was broken in April, prior to its 20% drop. The RS line recently moved above its WMA, but does not yet show a completed bottom.
- The weekly OBV dropped below its support (line c) in May, and still looks weak despite the recent bounce.
- The OBV needs to move above the September highs to improve.
- There is next weekly support in the $9.25 area.
General Motors (GM) briefly surpassed its daily downtrend (line d) in the middle of September. GM did have a nice bounce on Tuesday, as it was up 2.5% and closed well above its flat 20-day EMA.
- There is key weekly resistance now at $25.15, and a close above it would be positive.
- The daily relative performance has also recently tested its long-term downtrend (line f).
- A move in the RS line above this downtrend and resistance (line g) will suggest that a bottom is in place. This should also start a new uptrend on the weekly relative performance (not shown)
- The daily OBV did form a negative divergence at the February highs of $27.68.
- The daily OBV has been rising for the past month, and is above its WMA, but still below the long-term downtrend (line h).
- There is initial support on the daily chart at $22.71, and then in the $21.64 to $22.14 area.
What it Means: The relative performance of the auto manufacturers as well as these three key automobile companies should have kept you out of them in 2012.
Being in the wrong sector can be costly, as the SPDR KBW Bank ETF (KBE)-whose RS analysis has been positive-is up over 19% so far in 2012.
Of the three auto manufacturers, General Motors (GM) looks the most interesting but investors should wait until the weekly relative performance has bottomed before considering the long side.
How to Profit: No new recommendation at this time.


