It appears that beer shipments have turned the corner after a three-year bear market, and one major brewer in particular looks like a good buy now, writes MoneyShow's Tom Aspray.
Stocks put in quite a positive performance Thursday. The market internals were even stronger than prices, as the advancing stocks led the decliners by a 3:1 margin. This has improved the short-term momentum, which as of Wednesday's close indicated that the market's correction was over.
Friday's trading will be dominated by the monthly jobs report, which just came out and was much better than expected. The unemployment rate dropped below 8%, and the stock index futures are up nicely.
In the current market environment, the best stocks for new purchases are those that have a positive long-term technical outlook but have not participated in the market's recent strength.
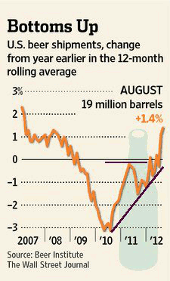
A recent article in The Wall Street Journal about beer shipments, which included a great chart, definitely caught my attention. This long-term chart shows the sharp decline in shipments in 2009, as well as the double bottom in 2010. The 2012 breakout and strong uptrend suggests that the trend of increasing shipments will continue.
Anheuser Busch Inbev (BUD) has had a great year, up over 45%, but are any of the major brewers worth buying now?
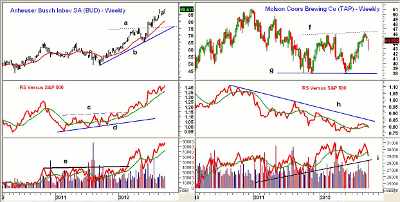
Chart Analysis: The weekly chart of Anheuser Busch Inbev (BUD) shows the breakout to new highs in June (line a). The correction from the May highs retested the highs from 2010-2011.
- From the June low at $64.99, BUD is up over 36%, and it is now well above the rising 20-week EMA at $79.60.
- The monthly Starc+ band is now just above $91, which is not far above current levels.
- The relative performance or RS analysis completed a major bottom in early 2012, as it broke out of its trading range (lines c and d).
- The RS line has continued to make new highs with prices, and is well above its rising WMA.
- The on-balance volume (OBV) also confirmed the price action, as it surpassed major resistance (line e) in early 2012.
- The OBV has confirmed the new highs, and is also well above its rising WMA.
- The daily studies (not shown) do allow for another push to the upside over the near term, suggesting investors will have to wait for a deep correction to get a good risk-reward entry point.
- There is initial support now at $83.50 to $84.50, and then stronger levels in the $80 area.
Molson Coors (TAP) is the $8 billion brewer that produces well-known brands like Heineken, Coors, and Miller. It currently yields 2.9%. The chart of TAP shows a broad two-year trading range (lines f and g).
- TAP has been correcting from resistance in the $46 area, but got a boost from this week's shipment data.
- As the article points out, beer sales are sensitive to employment levels. TAP peaked in 2008 at $59.51.
- The relative performance did form a negative divergence at the 2010 highs. This downtrend (line h) is still intact.
- The RS line has dropped below its WMA, but is still well above the early 2012 lows.
- A move in the RS line above the September highs would be positive.
- The OBV pattern is acting stronger, as it shows a long term uptrend (line i). The OBV may drop below its WMA this week, but needs to stay above the June lows.
- Good support now waits in the $41.60 to $42.60 area.
NEXT: Time to Tap Any of These Brewers?
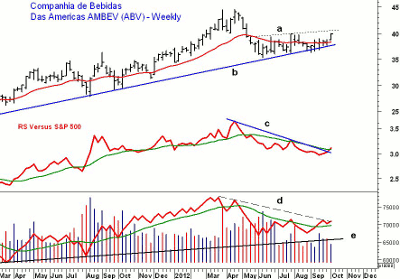
|pagebreak|Companhia de Bebidas Das Americas, better known as AmBev (ABV), is a $124 billion beverage company that peaked at $44.63 in April. It recently tested the long-term uptrend (line b) that goes back to 2010.
- There is key resistance on the weekly chart now at $40.60 (line a), with the 61.8% Fibonacci retracement resistance at $41.15.
- The weekly relative performance broke its downtrend (line c) in late September, and is now above its WMA.
- The weekly OBV has been above its WMA since the middle of September, and is now testing the bearish divergence resistance (line d) that goes back to the April highs.
- The OBV has long-term support at line e.
- The daily RS and OBV analysis (not shown) are both positive.
- The mid-point of this week's range is currently at $39.34, with further support now at $38.61.
- Key support sits in the $36 to $36.50 area.
What it Means: A strong weekly close in the major averages will suggest that the stock market has begun a new rally phase. This should take the S&P 500 close to the 15,000 level.
As for the brewers, AmBev (ABV) looks the best at slightly lower levels. For Molson Coors (TAP), I would only look to buy near the week's lows, where the risk and the yield are more attractive.
How to Profit: For AmBev (ABV), go 50% long at $39.18 and 50% long at $38.66, with a stop at $36.22 (risk of approx. 7%).
For Molson Coors (TAP), go 50% long at $43.34 and 50% long at $42.76, with a stop at $40.38 (risk of approx. 6.2%).


