The recent market turbulence has shaken investor confidence but have the market-leading sectors changed? MoneyShow's Tom Aspray evaluates the sectors to determine which ones are likely to continue outperforming the S&P 500 as we head into the end of the year.
Stocks were hammered from the opening bell Tuesday, though most of the major averages were able to close above the day’s lows. The Nasdaq-100 was stronger than the S&P 500, but even better than expected earnings from Facebook (FB) were barely able to rally the futures after the close.
Stock futures are higher in early trading, but a strong daily close is needed to signal that a rebound is finally underway. Though selling pressure has picked up, the NYSE Advance/Decline line is still holding above the recent lows and rising WMA. This suggests that this is a correction, not the start of a new bear market that many are already proclaiming.
A look at third-quarter sector performance along with the yearly numbers shows that the Select Sector SPDR Technology (XLK) is no longer leading. XLK is now just up 14.9% for the year. This reflects the 7.8% drop in XLK from the September highs, compared to the 3.9% drop in the Spyder Trust (SPY).
The top performer so far this year is the Select Sector SPDR Financial (XLF), up 21.8% through Tuesday’s close, followed by the Select Sector SPDR Consumer Discretionary (XLY) at 18%.
The Select Sector SPDR Health Care (XLV) has shown steady performance, gaining each quarter with a yearly gain so far of 15.6%. These three ETFs have also held up the best recently, as XLF and XLV are down just 3% from their most recent highs, while XLY is down 3.4%.
Though the selling has been heavier in the Select Sector SPDR Energy (XLE), as it is down 6.3% from its highs, XLE is still holding above the 38.2% Fibonacci retracement support from the June lows. Students of Fibonacci analysis know that it is typically the violation of the 61.8% resistance or support level that confirms a rally is over.
Four sectors continue to show stronger relative performance than the S&P 500, so they will need to be watched closely on the next rally, and their key support levels need to be monitored closely.
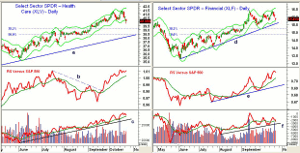
Chart Analysis: The Select Sector SPDR Health Care (XLV) dropped below the daily Starc- band Tuesday, with next support in the $39.50 to $39.75 area.
- The daily chart shows a potential double top formation, which has downside targets in the $39.10 area. This corresponds to the 38.2% Fibonacci retracement support from the June lows.
- The more important 50% support stands at $38.38, along with the daily uptrend (line a).
- The daily relative performance analysis broke its downtrend (line b) in September, and is still in a clear uptrend.
- The on-balance volume (OBV) does not show a pattern consistent with a double top, as it confirmed the recent highs.
- The OBV is above its WMA and the uptrend (line c).
- There is resistance now at $40.50 to $40.75, and then at the recent highs of $41.40.
The Select Sector SPDR Financial (XLF) peaked at $16.44 on September 14, with a secondary high last week of $16.29. XLF is now close to its daily Starc- band and next support at $15.76.
- The daily uptrend is at $15.60, with additional support at $15.40 and the former downtrend that was overcome in early September
- The 38.2% Fibonacci support is at $15.24, with the 50% support now at $14.87.
- The daily relative performance made new highs last week, confirming that XLF is still outperforming the S&P 500.
- The daily OBV did confirm the September highs, but has just closed below its WMA
- There is further OBV support at the uptrend (line f).
- There is gap resistance just below $16, with further levels in the $16.20 area.
NEXT: What's Ahead for the Consumer Sectors?
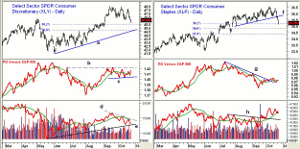
|pagebreak|The Select Sector SPDR Consumer Discretionary (XLY) made its high at $48.01 in September, and reached a secondary high of $47.97 in early October.
- The daily chart shows a series of lower highs and lower lows, as it has dropped back below the May highs.
- The 38.2% Fibonacci retracement support is at $45.48, with the 50% support at $44.70 along with the daily uptrend (line a).
- The daily relative performance has moved back above its WMA, and is trying to form a short-term bottom (line c).
- A move in the RS line above resistance (line b) would be a strong positive signal.
- The daily OBV is close to its uptrend (line e), and shows a pattern of lower highs (line d), which needs to be overcome to turn it positive.
- There is initial resistance now at $46.40 to $47.
The normally defensive Select Sector SPDR Consumer Staples (XLP) has lagged the S&P 500 by almost 4% so far this year, as it dropped below its uptrend (line f) last week.
- Tuesday’s close was on the 38.2% support level with the 50% retracement support at $34.82
- The key 61.8% Fibonacci retracement support is at $34.40.
- The daily relative performance broke its downtrend (line g) in early October.
- The RS line is below its WMA, but above support, so its action on any rally will be important.
- The OBV is acting much stronger, as it moved through resistance (line h) in September, and the volume on the decline has been light.
- The daily chart needs some work to turn around. Resistance stands at $35.70 to $36.
What it Means: The heaviest selling since last May has certainly spooked investors already disillusioned with the stock market. Though the decline has gone further than I expected, the technical damage so far has not been as bad as the headlines indicate.
It is also a surprise that the normally defensive Select Sector SPDR Consumer Staples (XLP) has dropped recently. Health care is another defensive sector that has a strong seasonal tendency to bottom in October.
The market is getting oversold, so a rally is likely by early next week. It should give us a strong indication if we are going to see another wave of selling.
How to Profit: Given the negative short-term momentum, and since I have previously recommended all except the Select Sector SPDR Consumer Discretionary (XLY), I would wait to do new buying until after the market has stabilized.
Portfolio Update: Investors should be long the Select Sector SPDR Financial (XLF) at $14.40, with a stop at $14.77.
Readers should also be long the Select Sector SPDR Health Care (XLV) at $36.14, with a stop at $38.42.
For the Select Sector SPDR Materials (XLB), investors should be 50% long at $37.26 and 50% long at $36.84, with a stop at $35.37.
Select Sector SPDR Energy (XLE) investors should be 50% long at $73.08 and 50% long at $72.74, with a stop at $68.86.
More recently, investors could have gone 50% long the Select Sector SPDR Technology (XLK) at $29.46 and 50% at $29.04, with a stop at $28.44.
Investors also could have bought the Select Sector SPDR Technology (XLK) in June at $28.18, then sold half at $31.54. Stop remains at $28.44.
- To see the current "Charts in Play" portfolio, click here.


