The seasonal trend, which usually sees the semiconductor group bottom in October, may be somewhat delayed this year. MoneyShow's Tom Aspray looks at the technical data to see what it foretells for the sector.
Even though stocks managed slight gains Thursday, news after the close pushed the futures sharply lower early Friday. The better-than-expected GDP numbers released today have relieved some of the selling pressure.
After the close on Thursday, Amazon.com (AMZN) disappointed the market with its earnings, and the stock dropped 7% in after-hours trading...but quickly rebounded to just a 1% loss.
Apple (AAPL) also disappointed with earnings of $8.67 versus an expected $8.75. Its stock dropped briefly below $600, but has also rebounded and is up slightly before the opening.
Both of my recommended buy levels for AAPL from October have been hit. A daily close above $636 would be the first sign that a bottom is in place for Apple.
The recent earnings from PC makers has reinforced the shift to mobile devices. As I noted in October, the Philadelphia Semiconductor Index ($SOXX) typically forms an initial seasonal low on October 5, with a secondary low at the end of October.
The technical outlook for a leading semiconductor ETF and the two leading mobile chip makers is still negative, with no signs yet of a bottom. Nevertheless, it is important to keep an eye on this key technology group.
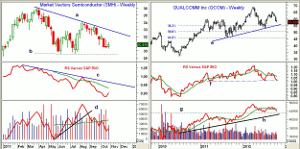
Chart Analysis: The Market Vectors Semiconductor ETF (SMH) appeared to form a double bottom in July (line a), which set up a good short-term trade. The rally showed signs of stalling in early August, and SMH soon topped out.
- Over the past few weeks, support at $30.30 has held, with the more important support from last summer in the $29.50 area (line b).
- The weekly relative performance dropped back below its WMA in August, and shows a longer-term pattern of lower lows.
- The RS line has turned up, but is still well below its WMA and the downtrend (line c).
- The weekly OBV formed a strong bullish divergence at the July lows (line d).
- The violation of the OBV uptrend in August was a sign of weakness. It now shows a pattern of lower lows.
- There is initial resistance now at $31.58 to $31.75, with stronger levels at $32.88 (line a).
Qualcomm (QCOM) recently came out with a new quad-core chip that some experts think has distinct advantages over its competitors. The weekly chart shows that its stock peaked in mid-September at $65.45.
- QCOM looks ready to close lower again this week, and is down 12.2% from its September highs.
- The uptrend that goes back to 2011 (line e) is at $55.76, with the 38.2% Fibonacci support from the 2010 low at $54.80.
- The July low was $53.09, with the 50% support level at $50.50.
- The weekly relative performance did confirm the early 2012 highs, but formed lower lows last summer.
- There is important support for the RS line at line f, which needs to hold on a further correction.
- The weekly on-balance volume (OBV) has dropped below its WMA, but is still above the converging support (lines g and h).
- There is initial resistance now at $59, with stronger levels in the $60 to $60.50 area.
NEXT: What Should Investors Watch For?|pagebreak|
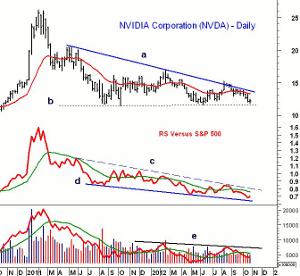
NVIDIA (NVDA) is also a company that many consider to be on the forefront of new mobile chips, but the long-term weekly chart shows that the stock has been weak since the 2011 peak at $26.17.
- The rally in the summer tried to overcome the long-term downtrend (line a), but even the July high of $15.22 did not convincingly break it.
- The chart shows that NVDA is once again close to long-term support in the $11.50 area (line b).
- The weekly relative performance tried to bottom last summer, but failed to overcome its previous highs before dropping back below its WMA.
- The RS line has recently made new lows and shows a pattern of lower lows (line d).
- The RS line needs to move above its downtrend (line c) and the July highs to complete a bottom.
- The weekly OBV moved above its WMA in June, but failed below the early 2012 highs, with key resistance at line e.
- The declining 20-week EMA is at $13.27, which now represents first resistance.
What it Means: As I have always stressed, the seasonal tendencies need to be combined with the technical readings. So far, there are no signs that the semiconductors—and especially these two leading mobile chip makers—have bottomed.
Clearly, given the long-term trend toward mobile devices, these are both stocks that should be monitored for signs of a turnaround. They have excellent long-term potential, even though they currently look weak technically.
How to Profit: No new recommendation


