Identifying a sector about to outperform and getting out before it starts lagging can dramatically increase your portfolio’s performance, as MoneyShow’s Tom Aspray takes a technical look at the four worst performing sectors of the past year.
All it took was some reassuring comments from Fed Chairman Ben Bernanke to calm the markets and take the focus off Cyprus. The majority of technical studies, like the Advance/Decline lines have turned higher again having maintained their up trends. Only the NYSE New Highs have not yet confirmed the new market highs but they have not given a sell signal yet.
Given the market’s strong performance so far in 2013, some may have forgotten the wide swings of the Spyder Trust (SPY) in 2012. The early 11.5% rally in 2012 was followed by an 11.2% decline, then the 15.8% gains (see chart) made it clear that we should never be complacent. The stock index futures are flat before the opening, and the first important support for SPY is at Tuesday’s low of $153.59.
In addition to identifying entry points that have a good risk /reward, being in the right sector and industry group has also been very important. Over the past three years, the Spyder Trust (SPY) is up 34% while the top performing DJ US Travel & Tourism Index is up over 170%.
The worst performing industry group over the three-year period has been the DJ Coal Index, which is down almost 58%. Some of the very volatile coal stocks like Alpha Natural Resources (ANR) and Arch Coal (ACI) have had some very dramatic, but brief rallies for nimble short-term traders. However, over the same three years, ANR is down 83%.
Before you buy any stock it is important to determine the technical outlook of both its sector and industry group. Over the last twelve months, these four industry groups are the ones you hopefully have avoided.
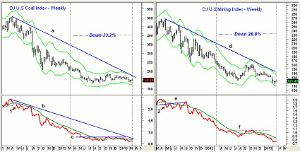
Chart Analysis: The DJ Coal Index also leads the one-year worst list as it is down 33.2% and it shows a long-term downtrend that goes back to the 2011 highs.
- In 2011, several drops to the weekly starc- band were followed by sharp rallies, which all were followed by further declines.
- There is first resistance at 164 with the downtrend now at 175.
- Relative performance broke support in May 2011 (point 1) that signaled the start of a downtrend.
- The long-term downtrend in the RS line (line b) is still intact, though there was a failed attempt to break through resistance at line c last fall.
- The RS line has just made further new lows.
The DJ US Mining Index is the second worst performer since March 2012 as it is down 26.8%, and it also contains the coal stocks, as well as gold and silver mining stocks.
- Three weeks ago, the index tested its starc- band and is now trying to bounce.
- There is next resistance at 131 to 144 with the weekly downtrend, line d, at 145.
- Relative performance completed its top in April-May 2011 as the support at line e was violated (point 2).
- From September 2011 through September 2012, the RS line stayed below its WMA.
- The RS line has made further new lows in 2013 and has key resistance now at line f.
NEXT PAGE: 2 More Lagging Sectors
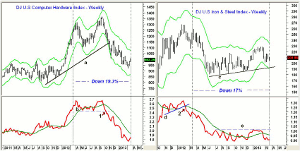
|pagebreak|The DJ US Computer Hardware Index that includes Apple Inc. (AAPL) and Dell Inc. (DELL) is down 19.3% over the past 12 months.
- The chart shows that a year ago, the index was trading near 1230 and eventually made a high of 1366 last September.
- The weekly uptrend, line a, was broken in November and the index hit a low of 921 three weeks ago.
- The weekly top in the relative performance was completed two weeks before the index broke its uptrend as the RS line support at line b was violated (point 1).
- The RS line dropped below its WMA two weeks after the index made its highs.
- There is first resistance now at 1050-1070 with stronger at 1150.
The DJ US Iron & Steel Index has also not had a good year as it is down 17% after making its high in early 2012.
- The index was making a secondary high last March and made its low of 179.50 last July.
- The weekly chart shows that this support, line c, is still holding.
- The rally early in 2013 hit a high of 229, which is now the key level of resistance to watch.
- Relative performance broke its three-month support (line d) last February, point 2.
- The RS line stayed below its WMA until it tried to bottom last fall.
- The RS line has key resistance at line e, which if overcome, would signal a bottom for this industry group.
What it Means: Over the past 12 months, the Spyder Trust (SPY) has gained 10.9%, so when compared to the DJ Coal Index’s drop of 33.2%, there is a difference of over 44%.
This is just a further illustration of why the multiple time frame relative performance analysis can be an important tool to use for your stock selection, as well as picking the sectors for your 401k.
A good site for industry group analysis is Big Charts.
How to Profit: No new recommendation.


