Last week’s weak GDP number failed to dampen the market’s continued advance, and today, MoneyShow’s Tom Aspray goes prospecting for good buys in a lagging sector.
The stock market was able to hold its gains last week with the Spyder Trust (SPY) up 1.78%, the SPDR Diamond Trust (DIA) up 1.2%, and the PowerShares QQQ Trust (QQQ) up 1.6% but the iShares Russell 2000 Index (IWM) led the pack as it was up 2.5%.
This week is likely to provide quite a test for the markets as there is a full slate of economic data for the markets to digest including the FOMC and ECB meetings. Asian and Europe markets are higher as are the US futures as they nervously await today’s economic reports.
The new highs in the NYSE Advance/Decline does favor new highs for the market but the test is likely to be this week’s early action. Though the PowerShares QQQ Trust (QQQ) had a good week, it is up only 0.8% in April and lagging the S&P 500. However some of the Nasdaq 100 stocks have done extremely well.
This table lists the top ten Nasdaq 100 performers over the past 30 days, which is led by Vertex Pharmaceuticals Inc. (VRTX) up close to 50% as it surged on positive clinical data in the middle of the month. It reports earnings on Tuesday, and as the table indicates, it is overbought as it closed 4.5% above its weekly starc + band .
Several of the stocks on the list had most of their gains last week, like Akamai Technologies Inc. (AKAM), which was up 27% last week in reaction to its earnings. There are two stocks on the list that appear to have completed their weekly corrective patterns and at the right price look attractive for new purchase.
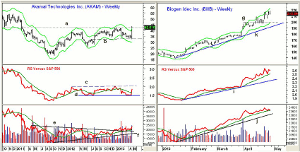
Chart Analysis: Akamai Technologies Inc. (AKAM) is a $7.58 billion provider of Internet content and cloud infrastructure that traded as low as $32.73 last Monday but closed the week at $42.61.
- The low last week corresponds to support, line b, that goes back to June 2012.
- AKAM closed above last fall’s high with the quarterly R2 resistance at $45.27.
- The relative performance has turned up from support, line d, and closed above its WMA.
- A move in the RS line above the resistance at line c will confirm it is now a market-leading stock.
- The weekly on-balance volume (OBV) broke through its resistance, line e, in December and has turned up from its WMA.
- The OBV has long-term support at line f.
- There is initial support at $38-$38.50 and the mid-point of last week’s range.
- The quarterly pivot is at $36.82.
Biogen Idec Inc. (BIIB) is a $50.6 billion biotechnology company that traded above its weekly starc+ band five weeks ago with a recent high of $218.45.
- The lower close last week sets the stage for a pullback with next support at $206 and then stronger at $197.50-$200 (line g).
- The uptrend, line k, is at $191.60 with the weekly starc- band at $180.40.
- The relative performance shows a pattern of higher highs and has confirmed the price action.
- The RS line is well above its WMA and support at line l.
- The OBV made new highs just a few weeks ago and is still above its WMA.
- There is more important support for the OBV at line j.
- BIIB is holding above its quarterly R1 resistance with R2 resistance at line $233.48.
NEXT PAGE: 2 Stocks to Buy on Pullback
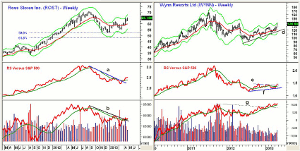
|pagebreak|Ross Stores Inc. (ROST) is a $14.3 billion operator of retail apparel and home fashion stores that reports earnings on May 23.
- ROST rallied from a low of $33.50 in August 2011 and peaked at $70.82 a year later.
- The 50% Fibonacci support at $51.97 was tested in late 2012 and ROST has since formed a pattern of higher highs and higher lows.
- There is next resistance at $67.05 with monthly predicted pivot resistance at $69.84.
- The weekly relative performance broke its downtrend, line a, and overcame its WMA in March.
- The OBV has also overcome its resistance (line b) but needs a stronger rally to confirm that it has bottomed.
- There is first support now at $62.50 with the rising 20-week EMA at $60.20.
Wynn Resorts Ltd. (WYNN) beat profit and revenue expectations last week as it gained over 6%. It closed just 3.5% below its weekly starc- band.
- There is further resistance at $138.25, which was the May 2012 high.
- In September of 2011, it traded between $157 and $161.
- The relative performance has just closed above its weekly resistance (line e) indicating it is starting to outperform the S&P 500.
- The weekly OBV broke its downtrend, line g, in early 2013 and shows a pattern of higher highs.
- It has been holding above its rising WMA.
- There is first good support in the $129.40 to $131 area.
- WYNN has more important support in the $124-$127 area with the quarterly pivot at $121.19.
What it Means: Both Akamai Technologies Inc. (AKAM) and Biogen Idec Inc. (BIIB) look the most overextended currently but a setback in AKAM will be watched closely.
Wynn Resorts Ltd. (WYNN) looks the most impressive technically and reports from Las Vegas indicate it is pretty much sold out for May.
A decent setback in Ross Stores Inc. (ROST) should also be a buying opportunity.
How to Profit: For Wynn Resorts Ltd. (WYNN), go 50% long at $128.82 and 50% long at $127.14, with a stop at $120.77 (risk of approx. 5.6%).
For Ross Stores Inc. (ROST), go 50$ long at $61.77 and 50% long at $60.88, with a stop at $58.19 (risk of approx. 5%).


