Money managers surveyed in Barron’s most recent poll consider the tech sector one of the best bets for the next six to 12 months, and MoneyShow’s Tom Aspray investigates whether the charts validate their bullish outlook.
More contradictions in Monday’s new high for the S&P 500 as yields on the 10-year T-note continued to drop confirming that the rally in yields from last summer’s lows (see chart) is over.
The tech sector led the market higher as it gained 1.6%, which was more than double the gain of the S&P 500 or the Nasdaq Composite. Leading the tech sector were the 2.5% gains in Hewlett-Packard (HPQ), Miscrosoft Corp. (MSFT) and International Business Machines (IBM).
Historically, 2013 has already been a pretty good year as over the past 20 years, the S&P has averaged 7.86% a year. It is up 11.7% so far in 2013. A further resurgence in the tech sector could be enough to push the S&P 500 to over a 20% gain, which has happened six times in the past 20 years.
Looking inside the technology sector, there are some market leading tech industry groups and those that are lagging. One group of technology stocks has just broken out to new highs, and there is one stock in this group that looks close to completing a significant bottom.
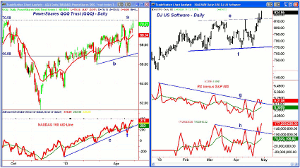
Chart Analysis: The Powershares QQQ Trust (QQQ) has pushed above the early April highs but is still barely below the September 2012 high at $70.58 (line a).
- The rally from the April 18 low at $66.88 has been impressive as the QQQ is up almost 5%.
- This low is now clearly an important level of support, line b.
- The Nasdaq 100 A/D line violated its uptrend, line c, on the recent drop before rallying sharply.
- The A/D line has confirmed the price action as it has moved above the April highs.
- There is key support now for the A/D line at the recent lows (see arrow).
- There is initial support for QQQ now at $69.19, which is the monthly pivot for May.
- There is further support in the $67.90-$68.50 area.
The DJ US Software Index (DJUSSW) completed its continuation pattern, lines e and f, in Monday’s session.
- The measured upside target from the chart formation is in the 845-850 area, which is 3% above current levels.
- A weekly close at current levels will complete a trading range that goes back to early 2012, which has upside targets in the 900 area.
- The relative performance broke its downtrend last week, line g, and turned up Monday.
- The OBV shows a similar formation volume and has been strong over the past week as resistance at line h has been overcome.
- There is first support in the 795-805 area.
NEXT PAGE: An Attractive Tech Stock
|pagebreak|Red Hat, Inc. (RHT) is a $9.43 billion application software company whose stock has recently seen a two million share increase in short interest.
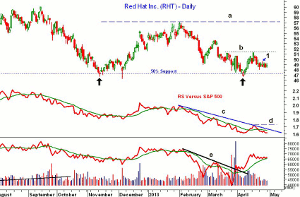
- The daily chart shows that it had a low of $46.34 in November and $46.75 in April (see arrows), which is a potential double bottom formation.
- These lows were just below the 50% Fibonacci retracement support calculated from the 2011 lows at $31.77.
- The daily chart shows that a doji was formed on Monday.
- A close above $49.28 would trigger a high close doji (HCD). (To learn more about the HCD sign up for this week’s trading lesson here).
- There is also short-term resistance at $49.49 (point 1) with further at $51.43, line b.
- A decisive close above the resistance at $57.17 (line a) would complete the double-bottom formation with upside targets at $67-69.
- The relative performance is still below its downtrend (line c) and needs to move above the resistance at line d to complete a bottom.
- The daily on-balance volume (OBV) broke its downtrend, line e, late March and is holding above its WMA.
What it Means: The software group is clearly one of technology’s strongest sectors and could help to push the overall market higher.
I would recommend a different entry strategy for Red Hat, Inc. (RHT) that is suitable for more aggressive investors.
How to Profit: For Red Hat, Inc. (RHT), go long on a stop at $49.64, and if filled, use a sell stop at $47.96 (risk of 3.3%).


