Last week's wide ranges in the stock market had many on edge but bond holders were even more concerned. Bond funds, managed by some of the world's best-known experts, endured double-digit losses in May but from the charts, this was not surprising say's Moneyshow's Tom Aspray.
The monthly jobs report calmed the stock market as the Dow Industrials was up 1.4% on Friday and gained almost 1% for the week. The bond market was not convinced as the yield on the 10-year T-note rose from 2.075% to 2.161% or a 4% increase.
A weekend article in The New York Times A Bond Market Plunge That Baffles the Experts focused on the sharp rise in yields. As they reported “mutual funds that invest in long-term United States Treasury bonds lost an average 6.8% in May, according to Morningstar, with the loss in principal wiping out years of interest payments.”
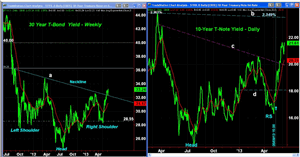
The uptrend in yields was evident on May 9 with the 10-year T-note yields (TNX) closing at 1.813%. The weekly reverse H&S bottom formation in the yields of the 30-year T-bond yield (TYX) that I discussed in the premier edition of Eyes on Income was confirmed the following day (May 28) as yields closed at 3.290%.
Key Yields to Watch: The reverse head-and-shoulders bottom formation was completed when the neckline (line a) was overcome.
- The rise in yields since early May has been sharp enough that I would
expect some consolidation or a pause in the rally over the next week or so.
- Only panic selling by bond holders could cause an upward acceleration in
yields.
- It may take the June monthly ending statements to really shock bond
holders.
- The next resistance for the 30-year T-bond yield (TYX)
is in the 3.426% to 3.489 area.
- There is further resistance now in the 3.629% area.
- The upside target from the reverse H&S formation is in the 4% area.
- A drop in yields back below 3.100% would weaken the uptrend.
The daily chart of T-note yields (TNX) shows the trend change on May 9 (see arrow) as yields moved above their 20-week EMA and resistance at line d.
- The downtrend, line c, was overcome on May 23 and the neckline from the
reverse H&S formation is now in the 2.349% area.
- A confirmation of the bottom in 10-year T-note yields would make bond
holders even more nervous.
- There is further resistance in the 2.682% area and then at 3.000%.
- The upside targets from the H&S formation are in the 3.340% area.
- There is initial support now at 2.066%.
- There is more important support now at 1.952% to 1.864%.
NEXT PAGE: A Mortgage Wreck & Portfolio Update
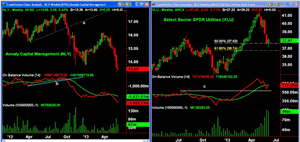
|pagebreak|Annaly Capital Management (NLY) is a yield play that I have been warning about for almost two years, and most recently, last November in Don't Step into the High-Yield Swamp. It has dropped 24% since the highs last September and currently yields 13.30%
- They cut their dividend in December for the second time in the year.
- Recent data indicates that they have just over $9 billion in cash but over
$100 billion in debt.
- Their current ratio is a dismal 0.21.
- The chart shows the break of support in the $16.80 area, line a, last
October.
- The on-balance
volume (OBV) confirmed the price action as it also broke support at line
b.
- The OBV made new lows last week and continues to be weaker than prices.
- The next good support is in the $12-$12.50 area.
Though NLY is getting oversold and is ready for a bounce, I would expect further dividend cuts in the next six months. The risk of capital loss is not worth the yields even though it is still being recommended frequently. Before following such advice, I would suggest you check the performance since it was first recommended.
Featured Investment: The high-yielding utility stocks have dropped sharply since they peaked in early May as fears over a change in Fed policy caused some heavy selling in this sector.
The Select Sector SPDR Utilities (XLU) currently yields 3.72% with an expense ratio of 0.18%. The top two holdings are Duke Energy Corp. (DUK) and Southern Company (SO) and the top ten holdings make up 57% of the portfolio.
XLU hit a high of $41.44 in early May, and at last week's low of $37.20, was down over 10% from its highs.
The 50% Fibonacci retracement support level from the late 2012 lows was broken last week. The 61.8% support is at $36.74 with additional chart support in the $35-$36 area.
The weekly OBV did confirm the highs in early May and has now turned up after getting near long-term support at line c. It is still below its WMA.
There is initial resistance now in the $38.85-$39.30 area.
Income Strategy: As I discussed in the last Eyes on Income report, the goal is to develop an income portfolio that will strive to provide a decent return, as well as some growth potential.
Portfolio Update: Based on a $100,000 portfolio.
On May 28, $1,000 was invested in Double Total Return Bond Fund (DLTNX) at $11.32 and an additional $3,000 on May 30 after it closed below $11.34. Another $4,000 was invested on Monday June 3 at $11.28 as it closed at $11.26 on May 31.
Another $1,000 should be invested today and the final $1,000 next Monday. This will then make up 10% of the portfolio.
New Recommendation: I would buy $2,500 of Select Sector SPDR Utilities (XLU) at $37.88 or better and $2,500 at $37.04 or better with a stop at $34.88.


