
The market's sharp decline on Thursday likely confirms that the stock market is in the top-building process, notes MoneyShow's Tom Aspray, and he advocates watching the inverse ETFs for buying opportunities on the rebound.
The earnings from Cisco Systems (CSCO) and Wal-Mart (WMT) combined with higher rates spurred by better unemployment numbers caused the heaviest stock market selling in quite some time. All the major sectors closed lower with seven losing more than 1%.
The decline was consistent with the deterioration in the technical studies that has been evident over the past few weeks. The divergence between the number of stocks making new highs and new lows was discussed in yesterday's column and the new lows spiked to 375 on Thursday.
The McClellan Oscillator was also featured and it has dropped to -228, which is a moderately oversold level. This does increase the odds of a rebound in the next week or so.
Click
to Enlarge
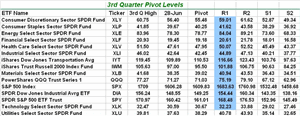
In my outlook for August, I continued to recommend taking profits as the market was moving higher and using the quarterly pivot point analysis in combination with starc bands can be a good way to identify profit-taking levels. In early July, I provided a table of third-quarter pivot levels to save for future reference.
I have now also added the third-quarter highs for each of the ETFs and only the Select Sector SPDR Utilities (XLU) has not reached its quarterly R1 resistance. Four of the ETFs have come within 1-2% of their R2 resistance levels before they reversed this week.
During the current market correction, it will be important to keep an eye on the quarterly pivot levels, which is at $161.01 for the Spyder Trust (SPY). They should provide an important level of support. Three of the four ETFS featured below were up over 8% at their quarterly highs.
Click
to Enlarge
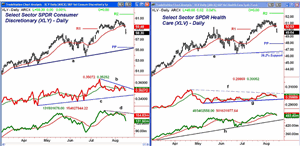
Chart Analysis: The Select Sector Consumer Discretionary (XLY) exceeded the quarterly R1 resistance at $59.01 in early July.
- XLY's high at $60.75 was just 1% below the quarterly R2 resistance at $61.62.
- The down gap opening Thursday completes a short-term top with next support in the $57-$57.50 area.
- The quarterly pivot is at $55.46 along with the daily uptrend, line a.
- The relative performance did form a short-term divergence, line b, at the recent highs.
- The RS line is holding well above the uptrend, line c.
- The on-balance volume (OBV) also formed a negative divergence at the recent highs, line d, and has dropped well below its WMA, as well as the prior lows.
- Initial resistance is now at $59.48 and the 20-day EMA.
The Select Sector SPDR Health Care (XLV) was one of my favorite sectors for 2013, and it hit a high of $51.50 on August 1, which was just 2% below the quarterly R2 at $52.52.
- The close Wednesday was the lowest since July 16, so those who bought in the past four weeks are now showing a loss.
- There is next support in the $49 area with the quarterly pivot now at $47.95.
- There is trend line support just below $47 (line e).
- The 38.2% Fibonacci retracement support from the November 2012 lows is at $46.48.
- The relative performance peaked in April and did not make a new high, line f, with prices.
- The RS line has strong support now at line g.
- The daily OBV did make a new high with prices but has just dropped below its WMA.
- The OBV has more important support at the uptrend, line h.
- There is initial resistance now in the $50.50-$50.80 area.
NEXT PAGE: What It Means
|pagebreak|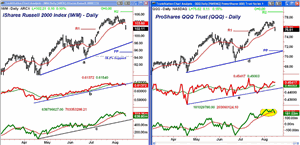
Click
to Enlarge
The iShares Russell 2000 Index (IWM) made a high of $105.63 on August 5, which was a gain of 8.9% for the quarter.
- The gap below support $103-$103.33 now creates a strong level of resistance.
- IWM is now just above the quarterly R1 resistance at $101.88, which was surpassed on July 11.
- The recent high was just 1% below the quarterly R2 resistance at $106.75.
- The daily uptrend, line a, is now at $97.60 with the quarterly pivot at $95.50.
- The 38.2% Fibonacci retracement support is now at $94.36.
- The relative performance has just slightly violated the support at line c.
- The daily OBV did confirm the recent highs but has now dropped below its WMA but does not yet show a completed top formation.
- The weekly OBV (not shown) is still above its WMA
ProShares QQQ Trust (QQQ) closed well below its 20-day EMA Thursday after it made a new rally high at $77.27 on Tuesday.
- QQQ opened the quarter above the pivot at $71.03, which was a bullish sign.
- The move above the R1 resistance at $75.19 set the next target at $79.10, the quarterly RS level.
- The next support is in the $73.70 to $74.40 area.
- The 38.2% retracement support from the November lows is at $71.14.
- This is very close to the quarterly pivot ($71.03) and daily uptrend, line d.
- The relative performance is still above its WMA but is below the July highs.
- The OBV may have formed a short-term top but there were no strong divergences at the highs.
What It Means: Thursday's sharp decline likely confirms that the stock market is in the top-building process. Given the weakness in the market internals, a rebound is likely by early next week.
Unless the A/D ratios are very strong on the rally, it should set up a good buying opportunity in the inverse ETFs for either a trade or to hedge your existing equity positions.
How to Profit: No new recommendation for now.
For additional reading: The Most Powerful Pivot Levels


