The Philadelphia Housing Sector Index led the market higher Tuesday, but some don't trust the rally in light of the higher mortgage rates. MoneyShow's Tom Aspray takes a technical look at the homebuilding ETFs and stocks to see whether now is the time to buy or sell.
For most of Tuesday's session, it looked as though stocks had completed a quite normal pullback after last Wednesday's post FOMC rally. The late day selling pushed the Dow Industrials and S&P 500 back into negative territory. The Nasdaq Composite, along with the S&P 400 and S&P 600 did close higher.
The A/D ratios weakened late in the day, but still closed positive and the homebuilders were the star performers. Both Lennar Corp. (LEN) and KB Home (KBH) reported better than expected earnings, despite rising mortgage rates during the quarter. Both stocks were up over 4% on the day.
In my early August analysis "When Will the Homebuilders Turn Around?" I was looking for them to decline further based on their technical readings. The 38.2% to 50% support levels were identified as likely downside targets.
I was looking for them to possibly bottom in September, ahead of the normal October or November seasonal tendency (see chart). Last week's FOMC announcement spurred heavy buying in the homebuilders as the iShares Dow Jones US Home Construction ETF (ITB) was up 4.8% on the day.
By Monday, ITB had already dropped back to its pre-FOMC lows which caused many to stick with their negative outlook on the group, but what do the charts say?
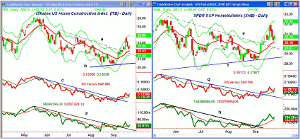
Chart Analysis: The iShares Dow Jones US Home Construction ETF (ITB) most closely follows the homebuilders, as it has over 30 stocks, with PulteGroup, Inc. (PHM), Lennar Corporation (LEN), and D.R. Horton, Inc. (DHI) its largest holdings.
- In August, the main support was identified at $20-$20.40 and the August 15
low was $20.18.
- The 38.2% Fibonacci
support from the October 2011 lows is at $19.30.
- Last week, ITB
reached the daily starc+ band with its high of $28.70.
- The three-day correction took ITB
back to the 20-day EMA before Tuesday's higher close.
- The former downtrend, line a, was almost tested and reached on the
correction.
- The relative performance broke its downtrend on September 9.
- The RS line has turned up from its WMA and has completed its bottom
formation.
- The OBV also overcame its downtrend and retested its rising WMA on the
correction.
- There is support now in the $21.65 to $22.03 area, the 20-day EMA.
- Once above $23.70-$24, the next major resistance is in the $25.50 to
$26.19 area.
The SPDR S&P Homebuilders (XHB) concentrates more on the homebuilding-related stocks and was one of the two ETFS I wanted to buy on a dip earlier in the month.
- XHB
overcame its monthly pivot at $29.20 in early September, and hit a high of
$32.08 last Thursday.
- The May highs for XHB
were in the $32.55 to $32.69 area.
- Monday's drop just tested the 20-day EMA on Monday, which is now at
$30.18.
- The former downtrend, line e, and the starc-
band are now at $39.61.
- The sharp rally on September 9 took the relative performance above its
downtrend, line g.
- It has now turned up from its rising WMA, which is a positive sign.
- The OBV bottomed ahead of the relative performance, as it moved through
its downtrend, line h.
- There is minor support now at the $29.70-$30.20 area.
NEXT PAGE: Two More Stocks to Watch
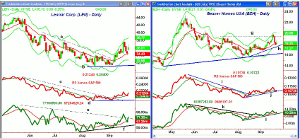
|pagebreak|The Lennar Corp. (LEN) completed a double bottom, line b, soon after its downtrend, line a, was overcome.
- LEN
reached a high of $37.84 last Thursday and then dropped slightly below the
minor 50% Fibonacci retracement support at $34.41.
- There is further support at $32.59 and the monthly pivot.
- The daily relative
performance shows a very positive pattern, as it formed higher lows, line
d, in August and September.
- The RS completed its bottom by breaking the downtrend, line c, and moving
above the August highs.
- The OBV was forming higher lows, as the stock was bottoming, as it was
acting stronger than prices, line f.
- The weekly RS and OBV analysis (not shown) are also positive.
- The downtrend from the May highs, line e, was broken last week. The volume
Tuesday was twice the average level.
- Once above $37.84, the 61.8% retracement resistance is at $39.27. The high
last May was $44.40.
Beazer Homes USA (BZH) is a smaller $451 million homebuilder that peaked in May at $23.29, but corrected to a low of $15.54 in early August.
- This was a correction of 33% from the May highs.
- The high last week at $19.92 was above the July high at $19.30.
- The 61.8% Fibonacci retracement resistance from the May highs is at
$20.32.
- The daily relative performance is in a solid uptrend, line j.
- The downtrend in the RS, line i, was broken on August 15.
- The OBV shows a similar positive pattern, as it closed back above its
rising WMA on Tuesday with support at line l.
- There is minor support now at $17.60 with the monthly pivot at
$16.91.
What it Means: The bullish earnings news and the year-to-year growth in the S&P Case-Shiller Housing Price Index both helped the homebuilding stocks on Tuesday.
Technically, they do appear to have bottomed and long positions were previously established in both iShares Dow Jones US Home Construction ETF (ITB) and in Lennar Corp. (LEN) as per last week's recommendation.
My buy levels in the SPDR S&P Homebuilders (XHB) was just missed and would adjust the order. I also like Beazer Homes USA (BZH) at slightly lower levels.
How to Profit: For the SPDR S&P Homebuilders (XHB), go 50% long at $30.53 and 50% long at $29.87, with a stop at $28.91 (risk of approx. 4.3%).
For Beazer Homes USA (BZH), go 50% long at $17.91 and 50% long at $17.27, with a stop at $16.49 (risk of approx. 6.2%). On a move above $19.20, raise the stop to $17.56 if long, or cancel order if buy levels have not been hit.
Portfolio Update: For iShares DJ Home Construction (ITB), it should be 50% long at $23.06 and 50% long at $22.43, with a stop at $20.93. On a move above $23.32, raise the stop to $21.82.
For Lennar Corp. (LEN), it should be 50% long at $37.09 and 50% long at $35.93, with a stop at $33.73.


