As the all-important holiday shopping season gets closer, MoneyShow’s Tom Aspray gets a jumpstart on his holiday shopping with his favorite retail stocks.
Even though the FOMC had no change in their bond-buying program, stocks were overdue for some profit-taking. The earnings for Facebook, Inc. (FB) after the close were much better than expected, but Western Union (WU), which missed earnings was down 12.4%.
Tuesday’s Retail Sales and Consumer Confidence data has caused an increase in bearish sentiment for the holiday shopping season though the drop in confidence was expected after the government shutdown. Some of the retail giants have been cautious for some time as eBay's CFO Bob Swan told reporters on a recent reference call that “we have a cautious outlook for the holiday season.”
Stocks are lower again early Thursday so a further pullback would not be surprising. I have been expecting the economy to surprise many on the upside and the strength of the casino stocks during the shutdown, I thought, was a sign that the consumer is not that negative about their future prospects.
In September, I pointed out that the retailing stocks “typically bottom around October 12” and then rally until April (see chart). Several of the key department store stocks have had nice rallies from the early October lows and a correction over the next few weeks should present a buying opportunity. Here are my favorites.
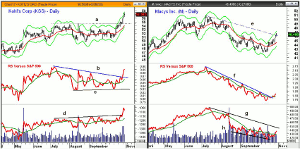
Chart Analysis: Kohl’s Corp. (KSS) broke though the daily chart resistance, line a, last week. They are scheduled to report earnings on November 14 and Barron’s had a bullish report on the stock last weekend.
- The width of the trading range has upside targets in the $59-$60 area with the quarterly R3 at $59.47.
- KSS is now testing the daily starc+ band, and for November, the monthly starc+ band is at $62.67.
- The daily relative performance has surged in the past few days as the downtrend from the July highs, line b, was overcome.
- The daily on-balance volume (OBV) formed a pattern of higher highs (line d) and higher lows before its recent upside breakout.
- The weekly studies (not shown) are solidly positive.
- There is first support now at $53.70-$55 with the quarterly pivot at $52.14.
Macy’s Inc. (M) was a stock I had recommended during the summer but it was stopped out before the bottom in the $42.18-$42.27 area was completed. They report earnings on November 13.
- The downtrend was tested on Wednesday as the stock was higher in spite of the market weakness.
- The 50% Fibonacci retracement resistance from the July high at $50.77 was been exceeded with the 61.9% level at $47.43.
- The quarterly R2 resistance is at $48.58 with additional resistance at $49.72.
- The daily relative performance broke its downtrend, line f, prior to the recent price surge.
- The daily OBV did make a new low with prices, line h, before moving above its WMA.
- The OBV is still well below its downtrend, line g, which needs to be overcome to complete a bottom.
- The weekly OBV (not shown) did confirm the July highs and the monthly is holding well above its rising WMA.
- The quarterly pivot is at $45.59 with more important support in the $43.60-$44.50 area with the rising 20-day EMA at $44.57.
NEXT PAGE: Tom’s Last Retail Pick
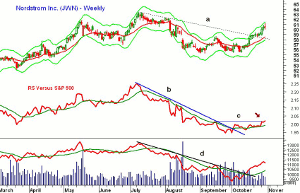
|pagebreak|The high-end retailer Nordstrom Inc. (JWN) reports its earnings on November 14. JWN had a doji low of $55.50 on October 9 and hit a high of $61.74 on Wednesday. This is a gain of 11.2%.
- The weekly starc+ band is at $62.14 with the July highs at $63.34.
- The downtrend, line a, was broken on October 18 and is now at $58.30 along with the rising 20-day EMA.
- The relative performance moved above its downtrend (line b) in early October.
- The RS line is just overcoming the resistance at line c.
- The OBV moved through its downtrend and WMA in the middle of the month.
- It is holding well above its rising WMA while the weekly OBV (not shown) is still below its WMA.
- There is first support at $59-$49.40 with the quarterly pivot at $58.21.
What it Means: All three of these retail stocks look ready for a pullback after their recent strength. A daily close below the prior two-three day lows will complete a short-term top and allow one to calculate the minor Fibonacci retracement levels.
The bullish signals from the weekly NYSE A/D line indicate that such a pullback should be a buying opportunity.
I would stick with longs in Kohl’s Corporation (KSS), but if it rallies from here instead of correct, I may look to take partial profits.
How to Profit: For Macy’s Inc. (M), go 50% long at $45.02 and 50% at $44.24, with a stop at $43.37 (risk of approx. 2.8%).
For Nordstrom Inc. (JWN), go 50% long at $59.12 and 50% at $58.24, with a stop at $56.47 (risk of approx. 3.8%).
Portfolio Update: Should be 50% long Kohl’s Corporation (KSS) at $52.37 and 50% long at $51.81, with a stop now at $51.77.
For a multiple time frame analysis of the top sectors, sign up for the Trading Lesson to be released later today.


