Although the stock market’s technical picture remains bullish overall, MoneyShow’s Tom Aspray points out the key indicators to watch to see how far the inevitable pullback will go.
Even the Twitter IPO could not stop nervous investors from selling while stocks dropped sharply as the afternoon progressed. The declining stocks led the advancers by a 4-1 margin. The up/down volume was even more one sided. Only a few sectors bucked the trend as auto parts and home furnishings were both up on the day.
Biotech stocks were the largest loser, down over 5%, but not far behind were the gold and silver stocks as they were down over 3.5%. The SPDR Gold Trust (GLD) had its lowest close in three weeks and the OBV is very close to breaking key support so the “bull trap” is about to spring shut.
The breakout failure in the Nasdaq 100, which had been leading the market higher, has weakened the short-term outlook which makes a further decline likely. The Spyder Trust (SPY) triggered a daily low close doji sell signal on Thursday.
As the market waits for the delayed jobs report, most investors are wondering whether they should be selling, selling short, or waiting to buy the correction.
The positive signal from the Dow Theory favors the long side of the market and suggests that the euphoria over the Twitter IPO will create a buying opportunity as some of the market-leading stocks will pull back to good support. It could also take some of the most oversold Dow stocks back to good buy levels where the risk on new long positions can be well controlled.
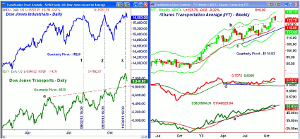
Chart Analysis: The comparative chart of the Dow Jones Industrials (DJI) and Dow Jones Transports (DJT) allows one to keep track of these two key market averages.
- In 2012, the Dow Jones Transports diverged from the Industrials for the entire year as it failed to surpass the July 2011 high at 5627.
- In contrast, the Dow Jones Industrials surpassed the 2011 highs in February 2012 and then accelerated to the upside.
- This divergence was resolved in early 2013 as the Transports again became a market-leading sector.
- The daily chart shows that both made new highs on August 2, 2013, (line 1) and on September 19 (line 2).
- Then, in the middle of October, the Transports broke out to the upside as the resistance at line a was overcome.
- The Transports made a new high on Monday, November 4, and reached the quarterly R2 resistance level at 7116 (line 3).
- The Industrials followed suit by making a new high on Wednesday.
- Both averages have first strong support at their quarterly pivots.
The iShares Transportation Average’s (IYT) top holdings are Union Pacific (UNP), FedEx Corp. (FDX), Kansas City Southern (KS), and United Parcel Service (UPS). IYT is up 30.8% so far in 2013.
- The weekly chart shows the breakout of the trading range, lines b and c.
- A lower close looks likely this week and it may be below last week’s low of $123.80.
- The breakout level (line b) is now at $122.11 with additional support at $121 to $119 area.
- The 50% Fibonacci retracement support from the June low is at $117.68 with the quarterly pivot at $116.63.
- The relative performance moved above its WMA in September and it is still holding well above its rising WMA.
- The weekly OBV also confirmed the September highs and made further new highs last week.
- The daily OBV did confirm the recent highs but has now dropped below its WMA.
What It Means: A correction in the stock market would help reduce the relatively high level of complacency and reduce the bullish sentiment. The weekly close should give us a better idea of what type of correction is most likely.
A drop back to the September highs is likely, which would mean another 2.2% lower in IYT but it should hold above the October lows.
Be sure to check the stops in the Charts in Play portfolio.
How to Profit: For iShares Transportation Average (IYT), go 50% long at $120.34 and 50% long at $118.74, with a stop at $113.91 (risk of approx. 4.7%).
Editor’s Note: If you’d like to learn more about technical analysis, attend Tom Aspray’s workshop at The Traders Expo Las Vegas, November 20-23, 2013. You can sign up here, it’s free.


