
With the stock market already jittery from current geopolitical turmoil, MoneyShow’s Tom Aspray takes a technical look at some US companies who have a lot riding on China’s continued growth.
The week is starting off on a more positive note as while the Asian markets were mixed, stocks in Europe are showing solid gains in early trading. The outcome of the Crimea vote was pretty much predetermined and the technical outlook discussed on Friday did favor a rebound this week.
If the futures can hold their gains into the close, then typically, stocks will rally further into the middle of the week. The volume and market internals need to be very strong on a rally to reverse the deterioration from last week. For the S&P 500, there is initial resistance in the 1855-1860 area but it will take a close above 1875 to make those on the short side nervous.
The weak economic data out of China has continued to weigh on the market as the recent bond default has made more wonder if the Chinese economy is really that fragile. The key numbers from China will come out next Sunday night when we get the HSBC Manufacturing flash PMI.
In reviewing recent filings, these four companies stood out for the percentage of their revenue that comes from China. Because of this, they are likely to get the attention of both bullish and bearish investors.
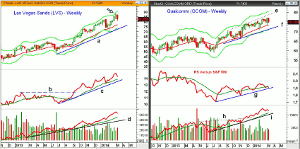
Click to Enlarge
Chart Analysis: Wynn Resorts (WYNN) and Las Vegas Sands (LVS) reportedly get 73% and 64% respectively of their revenue from their gambling operations in Macau. It is a favorite destination for Chinese gamblers. Revenues have dropped slightly in early 2014.
- LVS hit a high two weeks ago at $88.28 as it came close to its weekly starc + band (see arrow).
- The high was also quite close to the quarterly projected pivot resistance at $89.82.
- The correction has already retraced 38.2% of its rally from the February spike low at $69.15.
- The 50% Fibonacci support is at $78.80 with the 20-week EMA at $77.11.
- The 61.8% support at $76.55 with the uptrend, line a, at $72.85.
- The weekly relative performance did confirm the recent highs and shows a strong uptrend, line c.
- The RS line broke through resistance, line c, in the middle of last September.
- The weekly OBV also looks strong as its WMA is rising strongly.
- The daily OBV (not shown) moved back above its WMA Friday, triggering an AOT but signal.
- There is initial resistance now at $84.60-$86.
Qualcomm (QCOM) is a leading producer of cell phone chips that had 49% of its sales from China as of the end of 2013. They have had some regulatory issues in China recently but the company expects to benefit when the country changes to 4G LTE networks.
- QCOM hit a high of $77.20 over the past two weeks.
- The stock has already dropped 4.4% from its highs and is close to the monthly pivot at $74.23.
- The March low was $73.04 with the rising 20-week EMA at $73.38.
- The quarterly pivot at $70.91 was tested at the early February lows with the weekly uptrend at $71.38 (line f).
- There is near-term resistance now at $75.50-$76.
- The weekly relative performance closed last week just below its WMA and shows a shallow uptrend, line g.
- The OBV staged an upside breakout in November as resistance at line h was overcome.
- The weekly OBV shows a slight negative divergence but is well above its WMA.
- The daily OBV (not shown) is below its WMA but confirmed the recent highs.
NEXT PAGE: 2 More China-Dependent Stocks
|pagebreak|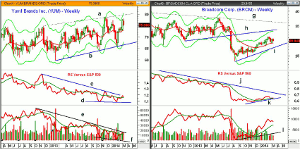
Click to Enlarge
Yum! Brands Inc. (YUM) is the well-known operator of KFC, Taco Bell, and Pizza Hut in China. Their financials indicate that they receive 37% of their revenues from China.
- The weekly chart shows that the stock has been in a wide range, lines a and b, since the summer of 2012.
- The starc+ band was tested two weeks ago with the high at $77.75, which was just below the November high of $78.28.
- The weekly starc+ band is now at $80.35.
- There is initial support now at $72.96 and the 20-day EMA.
- The late January low was $65.83, which was just below the quarterly pivot $66.57.
- The relative performance is now testing the downtrend, line c, from the 2013 highs.
- The RS line shows a potential bottom formation, line h, and a move above the November high would be bullish.
- The on-balance volume (OBV) has broken through short-term resistance and its WMA.
- A move above the previous highs, line e, would be bullish.
- The weekly OBV did make lower lows in January, line f.
Broadcom Corp. (BRCM) is a semiconductor provider for both wired and wireless communications. They receive 32% of their revenue from China.
- The stock dropped sharply from the May 2013 high of $37.43.
- It has been rebounding from the August low of $23.06 but is still well below the former support, now resistance at line h.
- The 20-week EMA is now at $29.27 with the monthly pivot at $29.94.
- The late-January low was $28.19 with the quarterly pivot at $27.89.
- The relative performance shows a shallow uptrend, line k, and is now testing its WMA.
- The weekly RS line is well below the resistance at line j.
- The weekly OBV moved strongly above its WMA in November and shows a strong uptrend, line l.
- There is near-term resistance at $30.40 with the quarterly projected pivot resistance at $31.27.
What It Means: The sentiment on China is decidedly negative and the key China ETFs also still look negative technically. I am less pessimistic longer term but we need to see positive signs before buying the ETFs.
Of the four stocks, YUM! Brands (YUM) looks the most promising, especially basis the relative performance analysis. A tight stop will need to be used as it is quite volatile.
How to Profit: For YUM! Brands (YUM), go 50% long at $74.14 and 50% at $73.52, with a stop at $71.39 (risk of approx. 3.3%).


