
Gold and mining stocks have been range-bound in the first quarter, but with some miners notching double-digit gains in the past month, MoneyShow’s Tom Aspray wonders whether there are any good buy candidates in this group now.
The rally that I thought at last Friday’s close would happen by mid-week came even earlier than I expected. The quite strong Retail Sales data helped support prices as did the good earnings from Citigroup (C) that surprised many analysts. The rally was still not enough to erase the negatives from last week.
The futures are higher in early trading but the European markets are lower as was Hong Kong’s Hang Seng Index in reaction to a decline in China’s money supply. China watchers are nervously waiting for the 1st quarter GDP data out Wednesday.
The NYSE A/D line has turned up from support but needs another strong day of market internals to overcome its first resistance. This is clearly a rally that will need to be watched closely for signs of a rally failure. The S&P Metals & Mining Select Index (SPSIMM) was discussed last August and since then it has gained 11%, about the same as the Spyder Trust (SPY).
Some of the biggest global miners have seen double-digit gains over the past month as some have overcome their weekly downtrends, but does this mean they are good buy candidates now?
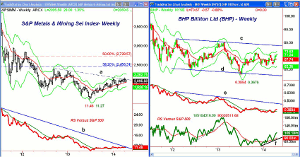
Click to Enlarge
Chart Analysis: The weekly chart of the S&P Metals & Mining Select Index (SPSIMM) shows that it is now testing the weekly downtrend, line a, that goes back to the late 2012 and early 2013 highs.
- The Index has been testing its rising 20-week EMA over the past six weeks with the weekly starc+ band now at 2262.
- The Index had a high of 3864 in early 2011 and the 38.2% Fibonacci retracement resistance is at 2456.
- There is key support now in the 1911 area, which corresponds to the early-February low.
- The weekly relative performance is testing its long-term downtrend, line b.
- The RS line has been flat since last summer, consistent with an industry group that is just keeping pace with the S&P 500.
- The daily RS analysis (not shown) does look better as it has formed an uptrend since the early November lows.
BHP Billiton Ltd. (BHP) is a huge $189.5 billion global mining company that has had a rough year. It is shed some unproductive assets as plunging iron ore prices have had a significant impact on its earnings.
- BHP is up 10% over the past month but just 6.19% YTD.
- The weekly chart shows a broad trading range since early 2012, lines c and d.
- The stock is just below its weekly starc+ band at $73.63 with the quarterly projected pivot resistance at $74.90.
- There is stronger weekly resistance, line c, at $77.76.
- The stock hit a high of $94.97 in early 2011.
- The weekly relative performance has stayed in a narrow range since last summer and is well below the long-term resistance at line e.
- The weekly OBV is in a short-term uptrend, line f, and is trying to complete its bottom formation.
- The daily studies (not shown) do look much more positive.
- There is initial support at the $69 area and the daily downtrend (not shown) that was broken in early April.
- The 20-week EMA is now at $67.74 with the quarterly pivot at $66.47.
- BHP hit low of $64.54 on March 21.
NEXT PAGE: 2 Miners to Watch
|pagebreak|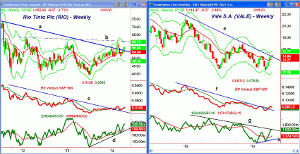
Click to Enlarge
Rio Tinto Plc (RIO) has about half the assets of BHP and recent data suggests it gets about 1/3 of its sales from China. It is up 9.12% in the past month and 11.03% in the past three months.
- The weekly downtrend, line a, from the early 2011 highs, was broken in the first part of January.
- There is a strong band of resistance now in the $60.70 area, line b, and the weekly starc+ band.
- RIO has just moved back above its downtrend again over the past three weeks with the 20-day EMA at $54.54.
- This is just below the quarterly pivot at $55.11.
- The key support is now at $51.20, which was the March low, and the quarterly projected pivot support is at $50.78.
- The relative performance has moved back above its WMA after breaking its downtrend, line c, in early 2014.
- The weekly on-balance volume (OBV) bottomed last July and is now in a solid uptrend, line d.
- The daily OBV (not shown) is now trying to turn up from its rising WMA.
Vale S.A. (VALE) is a $74.38 billion Brazil-based miner, which like the other two gets the majority of its revenue from the sale of coal and iron ore. The stock is up 18.82% in the past month but just 9.2% over the past three months.
- The weekly downtrend that goes back to early 2012, line a, is now being challenged.
- The weekly starc+ band is at $15.71 with the November 2013 high at $17.14.
- In early 2012, VALE had a high of $26.87.
- The relative performance has broken its downtrend, line f, and appears to have completed its bottom formation.
- The weekly OBV is testing its downtrend, line g, with strong resistance at the October highs.
- The OBV did form a short-term bullish divergence, line h, at the early-March lows.
- The daily OBV (not shown) is also positive and shows no signs yet of a top.
- There is initial support at $14.27 and the 20-week EMA.
- The quarterly pivot is at $13.31 with the monthly at $13.05.
What It Means: It has been my view for some time that the economic data in the US and Eurozone will continue to improve in 2014. This, I think, will cause a revival in the emerging markets, including China.
This would be a positive for the big mining stocks but the current technical outlook does not favor buying them at current levels even though they could go a bit higher over the near term. I will be watching Vale S.A. (VALE) if it has a significant pullback over the next several weeks.
How to Profit: No new recommendation


