Yearly charts usually get far less attention than their shorter brethren, but they still have useful lessons to give smart investors. MoneyShow's Tom Aspray analyzes the yearly trends for these four key markets to point out what levels you should be watching for the rest of 2014.
The World Bank’s reduction in its outlook for global growth was a good excuse for profit-taking, Wednesday, with utility stocks being hit the hardest as the Dow Jones Utility Average was down 1.22%. The market internals did not reflect heavy selling, and in early European trading, the markets are mixed with the futures slightly higher.
I would not be surprised to see some follow through selling as the Spyder Trust (SPY) is still over 1% above its 20-day EMA at $192.32, with the S&P 500 futures showing next good support in the 1919-1928 area. The technical studies continue to suggest that this pullback is a buying opportunity both for individual stocks and ETFs.
The choppy action of the past few months has further reinforced the importance of using the long-term charts in order to maintain a clearer perspective on the market’s trend. Over the years I have observed that many traders pay too much attention to the intra-day and the monthly charts. Some of my best recommendations come from the monthly review of the stocks in the Dow Industrials.
Every quarter, I publish a table of the quarterly pivot levels for the key ETFs that I monitor on a regular basis. Several times a year, I also look at the yearly charts of several key levels as it often helps me put the year in perspective, as well as identify key levels of support and resistance.
A break either above the prior year’s high or below the low can often warn of a change in trend. For example, at the end of 2007, the S&P 500 closed at 1,468.36, and the year’s low was 1,363.98. This low was broken in January 2008, giving advance warning of the coming bear market.
Some investors, as well as quite a few traders, might be surprised to learn that many successful long-term traders pay considerable attention to the yearly price ranges of the key markets.
Let’s look at the yearly charts for the stock market, gold, and crude oil.
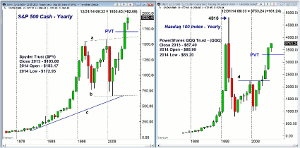
Chart Analysis: The yearly chart of the cash S&P 500 shows the strong upside breakout in 2013 as resistance from 2000, line a, was overcome.
- The width of the trading range (lines a and b) has upside targets in the 2500-2600 area.
- The yearly pivot is at 1707 with the R1 resistance at 1989.
- The 2014 low is at 1737.
- There is yearly chart support first at 1630 (line a) with the S1 support at 1566.
- It would take a lower yearly close (below 1848) to turn the chart less bullish.
- For the Spyder Trust (SPY), the yearly open at $183.17 and the 2013 close at $183.88 should now be first major support.
- The yearly pivot is at $169.90 with R1 resistance at $197.86 and S1 support at $155.91.
The chart of the Nasdaq 100 looks fairly similar to that of the S&P 500 despite the sharp decline earlier in the year.
- The yearly R1 resistance is at 3893 with R2 resistance at 4194.
- The Nasdaq 100 broke out in 2011 as the 2007 high was decisively overcome.
- The 2013 close at 3592 is now at first support with the 2014 low at 3414.
- The pivot for the year is at 3291 and the year’s open at 3575 was well above the pivot.
- For the PowerShares QQQ Trust (QQQ), the yearly open at $86.99 and the 2013 close at $87.40 should now be first major support.
- The yearly pivot is at $79.92 with R1 resistance at $94.87.
- The 2013 close at $87.40 was violated during the spring drop as the 2014 low, so far, is $83.40.
NEXT PAGE: 2 More Yearly Charts to Watch
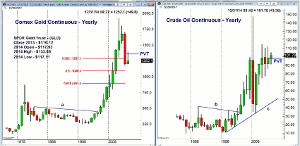
|pagebreak|The Comex Gold continuous contract is currently trading well below the yearly pivot, which is at $1359.
- Prices are still barely above the 2013 low of $1179.40 with the S1 support at $1021.80.
- The 38.2% Fibonacci support from the 1999 low to the 2011 high at $1923.70 was broken.
- The 50% support level is at $1089, and often, corrections in major uptrends do find support in this zone.
- There is resistance at the yearly opening price of $1204.
- If gold is able to move above the yearly pivot and the year’s high at $1392, then the R1 resistance is at $1540.
- The SPDR Gold Trust (GLD) is still well above both the yearly open at $117.93 and the 2013 close at $116.12.
- Even more important support is at the 2013 low of $114.46 with the S1 support at $98.92.
- The yearly pivot is at $131.66, which was overcome for two weeks in March.
- The year’s high is $133.69 and a move above this level would be positive.
- The R1 resistance is at $148.86 with the 2012 low at $148.53.
The yearly chart of the Crude Oil Continuous contract shows that the ranges have narrowed in recent years with just a $14 per barrel range, so far, in 2014.
- The range in 2013 was $26.30 and the low, so far in 2014, was $95.24, which is just below the 2013 open at $91.78.
- The yearly pivot is at $98.74, which was the low in early May.
- The yearly R1 resistance is at $111.79 with the 2013 high at $112.24.
- This was just below the 2012 high of $110.55 with the 2011 high at $114.83.
- Clearly, a yearly close above both of these highs would be very bullish for crude oil prices.
- The low in 2013 was $85.90, which is just above the S1 support at $85.45.
- A yearly close below both of these lows, on the other hand, would be quite negative.
What It Means: The yearly charts have kept one on the long side of the market for many years, and it would take a lower yearly close to change this outlook.
The 2013 decline in the SPDR Gold Trust (GLD) below the 2012 low at $148.53 turned the yearly outlook negative. It would take a move above the 2014 high of $133.69, and likely a close back above $148.53, to stabilize the yearly chart of GLD.
Crude oil still looks positive as the new highs in 2014 keeps the focus on the upside.
How to Profit: No new recommendation
Portfolio Update: Should be 100% long the Spyder Trust (SPY) at $185.02. Use a stop at $185.83.
Should be 50% long PowerShares QQQ Trust (QQQ) at $86.88 or better. Use a stop now at $86.47.


