Widespread selling was in full-force by the close on Thursday, so MoneyShow’s Tom Aspray examines the charts of one industry group that was down and one that was up for the day to see if they can shed any light on what might lie ahead.
The pre-opening market tone on Thursday suggested weakness but not the widespread selling that was in force by the close. Sharply lower German exports, Ebola, and plunging oil prices all helped to push stocks lower. Only 390 stocks advanced while 2800 declined with the ARMS Index closing at 1.53.
The NYSE A/D line did make new correction lows as did the S&P 1500 A/D line. The McClellan oscillator reversed from -18 to -128 but is still holding above the bullish divergence support. As I noted in yesterday’s column, to confirm a short term bottom “the market needs to add to Wednesday’s gains in an impressive fashion.”
Clearly, Thursday’s action indicates the downtrend is still in force though the SPDR Dow Industrials (DIA), Spyder Trust (SPY), and the PowerShares QQQ Trust (QQQ) are still holding above the August lows. The NYSE Composite has dropped below the August lows while the iShares Russell 2000 (IWM) has broken below the February lows.
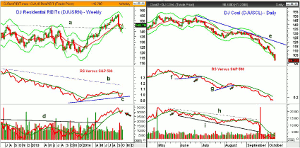
A review of the industry groups shows that the energy and natural resource stocks were hit the hardest. Crude oil was down over 3% and is testing the daily starc- band. The DJ Coal index lost 6.75% on the day with the oil & gas exploration and production stocks were down 4.3%. On the plus side, the DJ Residential REITs were up 0.31% for the day. Do the charts of these two industry groups shed any light on what lies ahead?
Chart Analysis: The DJ Residential REITs (DJUSRN) tested its weekly starc- band over the prior two weeks but looks ready to close this week higher. Many of its components like Equity Residential Properties (EQR), American Campus Communities (ACC), and Avalon Bay Communities (AVB) are up over 2.5% in the past month.
- DJUSRN broke through multi-year resistance, line a, in early May.
- This important support has now been tested.
- A weekly close back above the 20-week EMA at 146 would be positive.
- The weekly relative performance is trying to bottom as it has formed higher lows.
- The RS line looks ready to close the week back above its WMA.
- There is longer-term resistance for the RS at line b.
- The weekly OBV broke through major resistance, line d, in March as it lead prices higher.
- The OBV should close the week back above its WMA.
- The daily studies are positive but DJUSRN is now testing its daily starc+ band so we may see a brief pullback.
The DJ Coal index has had a rough year as it closed 2013 at $141.49 and is now down over 30% for the year.
- The close Thursday was well below the daily and weekly starc- bands.
- The industry group started to break down in May as the relative performance dropped below its WMA.
- The RS analysis shows that it tried to stabilize in both June (line f) and in August (line g).
- These periods were just interruptions in the downtrend and the RS line has been plunging since late August.
- The daily on-balance volume (OBV) also topped out in May.
- The OBV shows a pattern of lower highs, line h, since May.
- Volume surged in September as the OBV dropped sharply below its support at line i.
- The weekly OBV is also well below its WMA and is close to the July 2013 lows.
- There is initial resistance at 105 with the declining 20-day EMA at 112.27.
What it Means: With the EuroZone markets down from 1.5-2% early Friday, it looks like we could get another ugly day for the stock market. Many of the technical studies are already quite oversold so a bounce is likely by the middle of next week.
Once the current decline is over, the REITs should be on your buy list basis the strong relative performance analysis. I would not bottom fish yet in the coal stocks though, they are likely to be higher a year from now.
How to Profit: No new recommendation.


