With Christmas shopping season in full swing, many are watching the retail stocks, which are a mixed bag, so MoneyShow’s Tom Aspray investigates the charts of an ETF and two individual stocks for the best way to play the sector.
It was another day when stocks were buffeted by cross currents as the S&P futures were down almost 10 points in early trading as comments from Mario Draghi spooked the EuroZone markets. News later in the day that there actually was a stimulus plan soothed the US markets with the futures closing down just a point.
The Euro markets are showing nice gains in early trading with the German Dax up 1.3% on the back of similar gains in the Shanghai Composite overnight. The Dax had made a new all time high early Thursday before the ECB news caused the market to turn lower.
As the Christmas shopping season is in full swing, many are watching the retail stocks, which are a mixed bag. The largest holding in the SPDR S&P Retail ETF (XRT) is Tractor Supply Co. (TSCO), which is up 8% in the last month, while the second largest holding Whole Foods Market Inc. (WFM) is up over 22%.
The news has not been as rosy for other retailers as Aeropostale Inc. (ARO) was down over 28% Thursday and Abercrombie & Fitch Co. (ANF) is down 14.64% in the past month. So, what is the best way to play retail?
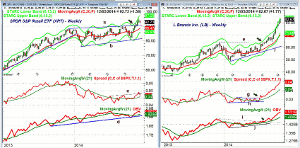
Chart Analysis: The SPDR S&P Retail ETF (XRT) has holdings of just $825 million with an expense ratio of 0.35%. The ETF has 100 holdings with the top ten making just 11.8% of the ETF.
- XRT is up just 5.90% as it has been lagging the S&P 500.
- The weekly chart shows that XRT broke out of a major trading range, lines a and b, just four weeks ago.
- The weekly starc+- band is at $97.25 with the monthly projected pivot resistance at $99.98.
- The width of the trading range has targets in the $102 area.
- The weekly relative performance has also moved slightly above the resistance at line c.
- This likely completes a bottom formation and a move above last week’s highs will confirm it.
- The weekly OBV is above its WMA but has not yet moved above the July highs.
- The rising 20-day EMA is at $91.65 with the daily starc- band at $90.70.
- The monthly projected pivot support is at $89.41.
One of the standouts in the retail sector has been L Brands Inc. (LB), which is another of the largest holdings in XRT. LB is up 37.48% YTD and over 28% in the past three months.
- The weekly chart shows the breakout above the late 2013 highs, line e, in July.
- The chart targets have already been met with monthly projected pivot resistance at $88.61.
- The weekly starc+ band has been tested for the past five weeks.
- The relative performance completed its bottom formation (lines g and h) in early August.
- The RS line is rising sharply, consistent with a market leading stock.
- The weekly on-balance volume (OBV) broke through its resistance, line I, ahead of prices.
- The OBV has continued to lead prices higher and the daily is also confirming the new highs this week.
- LB is quite overextended as it is well above the 20-day EMA at $78.52 and the daily starc- band.
- The monthly pivot is at $77.95 with the rising 20-week EMA in the $70 area.
Next: Another Retail Stock to Watch
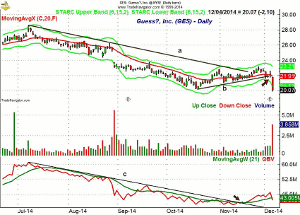
|pagebreak|Guess? Inc. (GES) was trying to bottom since the October low of $20.19. The stock is now down 33.23% for the YTD as it has dropped sharply over the past week.
- GES lost 9.5% in Thursday’s session as it reported earning after the close on Wednesday.
- They beat 3rd quarter expectations and were up in after hours trading.
- The focus by Thursday’s opening was on the weak guidance and the stock gapped lower.
- The volume was four times the average as it closed well below the daily starc- band.
- The daily OBV broke its downtrend, line c, in early November and began a new uptrend.
- The OBV has now dropped back below its WMA.
- The next support is at $21 and then at the October low.
- The quarterly projected pivot support is at $17.43.
- A close above the November 25 high at $23.19 is needed to stabilize the chart.
What it Means: Buying individual retail stocks has been harder than normal this Christmas season as L Brands Inc. (LB) and Guess? Inc. (GES) illustrate.
Therefore, the best way for most to participate in the retail sector is through SPDR S&P Retail ETF (XRT).
How to Profit: For SPDR S&P Retail ETF (XRT) go 50% long at $91.12 and 50% at $89.76 with a stop at $85.90 (risk of approx. 5%).


