
The tech sector has been lagging the S&P 500 for most of the year, but several industry groups pulled ahead with Tuesday's gain, so MoneyShow's Tom Aspray takes a technical look at how his recent strategy to buy this industry and two semiconductor stocks played out.
Most of the major averages made new highs for the year in Tuesday's session, with the Dow Industrials, S&P 500, and Nasdaq Composite posting gains of over 1%. The Dow Utilities did even better as it was up 2.12% as these stocks had reached stronger support, as noted in Tuesday's review of the sector.
The tech sector, as noted by the relative performance analysis, has been lagging the S&P 500 for most of the year, but with Tuesday's gain, the PowerShares QQQ Trust (QQQ) has now pulled ahead. The close Tuesday was high enough to push prices just above its recent trading range (see chart) which has upside targets in the $109-$111 area.
Even more impressive Tuesday was the gain in the Market Vectors Semiconductor (SMH) which was up 3.29%. The technology hardware and equipment stocks also did well as they gained 2.36% on the day while the Internet stocks were up just 1.41%.
The semiconductor stocks were the focus of the January 22 column Will These Stocks Ignite the Tech Sector? where I detailed a strategy to buy this industry group and two semiconductor stocks during the recent correction. So, how did this strategy work? Let's take a look.
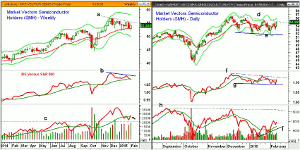
Click to Enlarge
Chart Analysis: The Market Vectors Semiconductor (SMH) has total assets of $464 million, a yield of 1.2%, and an expense ratio of 0.35%. There are 25 stocks in the portfolio, with Intel Corp. (18.7%) and Taiwan Semiconductor (15.4%) the two largest holdings.
- The weekly chart shows last week's higher close which was still below the downtrend, line a.
- The January high at $55.53 is the next key level on the weekly chart, with the starc+ band at $58.09.
- The quarterly projected pivot resistance is at $63.58.
- The relative performance has formed lower highs, line b, since the early December high. It should turn higher this week and move back above its WMA.
- The weekly OBV moved back above its WMA last week generating an AOT buy signal.
- The monthly studies (A Six-Point Checklist for a Profitable 2015) were positive in January.
- The 20-week EMA, now at $52.87, has been tested several times in 2015 but has not been violated on a weekly closing basis.
The continuation pattern in the Market Vectors Semiconductor (SMH), lines d and e, is more evident on the daily chart.
- SMH came quite close to its daily starc- band on Feb. 2 with the low of $51.84.
- The correction did hold above the quarterly pivot at $51.51.
- The daily chart requires a daily close above the daily doji high from January 23.
- The 127.2% Fibonacci retracement target is at $57.11 with chart targets at $59-$60 area.
- The daily relative performance has moved back above its WMA but is still below resistance at line f.
- The daily OBV formed higher lows (line i) while SMH was forming lower lows.
- The daily OBV has major resistance at line h.
- There is short-term support at the monthly pivot of $53.44 and Monday's low at $52.93.
Next: Two More Semiconductor Stocks to Watch
|pagebreak|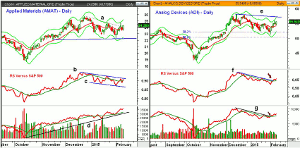
Click to Enlarge
Applied Materials (AMAT) was one of the two stock picks from last month when it had closed at $24.32. My recommendation (see below) allowed for a slight break of the January 14 low of $22.85.
- On February 2, AMAT dropped to a low of $22.29 before rebounding to close at $22.85 which was up 1 cent from the prior day's close.
- AMAT spiked to a high last week of $24.67 which was just above the prior swing high.
- The close Tuesday reaffirmed the breakout above resistance at line a.
- The chart formation has upside targets at $28 with the quarterly projected pivot resistance at $30.22.
- The daily RS lines are still in their trading range, lines b and c.
- The daily on-balance volume (OBV) has been much stronger as it has made a series of higher highs.
- There is strong OBV support at line d.
- There is minor support now at $23.48 and $23.79 where the 20-day EMA sits.
- The daily starc+ band is at $22.39.
Analog Devices (ADI) was also a recommendation and it dropped to a marginal new low at $51.29 on February 2.
- The correction dropped between the 38.2-50% Fibonacci support levels.
- It held above the 50% support at $50.14 and this is one of my favored entry techniques.
- The daily chart shows that the January highs have been overcome.
- The daily resistance, line e, is at $57.02 with the weekly starc+ band at $59.13.
- The quarterly projected pivot resistance is at $61.58.
- The daily RS line has broken its downtrend, line f, consistent with a potential market leader.
- The daily OBV has also broken its downtrend, line g.
- The weekly and monthly OBV are above their WMAs.
- The 20-day EMA is now at $54.21 with the daily starc- band at $52.26.
What it Means: It has been my market view since last week's Do Stocks Have Enough Juice to Breakout? that the weekly technical studies favored a bullish stance. A higher weekly close in the major averages will further support this view.
A continued rally in the semiconductor stocks will certainly help the technology sector regain its leadership role and this would be consistent with an economy that is getting even stronger.
Though I see no good risk entry to get back in Applied Materials (AMAT) as my buying level or stop clearly should have been lower, there is another semiconductor stock, Texas Instruments (TXN) that just broke out to the upside. Traders could look to buy it only on a slight pullback.
How to Profit: For Texas Instruments (TXN) go 50% long at $55.49 and 50% at $54.76 with a stop $52.73 (risk of 4.3%). Cancel the order on a move above $56.80. I will Tweet a chart later.
Portfolio Update: For Market Vectors Semiconductor (SMH) now 50% long at $54.36 and 50% at $53.22. Raise the stop from $51.21 to $52.29.
For Analog Devices (ADI) now 50% long at $52.88 and 50% at $52.10 (open on 2/1). Raise the stop from $49.86 to $50.87.
For Applied Materials (AMAT) should have gone 50% long at $24.06 and 50% at $23.48 but both were stopped out at $22.59 for a 4.9% loss.


