Some are concerned the Dow Jones Transportation Average hasn’t made a new high since November 2014, so MoneyShow’s Tom Aspray takes to the charts to see whether now is the time to exit or stay with existing positions in the Transports and railroads.
Stocks tried to stabilize on Monday but in early trading Tuesday it looks as though the sellers are back as most of the EuroZone markets are lower in early trading. The futures were only slightly higher Monday but have dropped sharply overnight as they have violated last week’s lows.
This is consistent with the market’s negative short-term momentum, which could keep the market under pressure at least until next week’s FOMC meeting. Last Friday’s review of the market’s technical outlook discussed both the short-term negative as well as the longer-term positive factors.
With Monday’s six year anniversary of the bear market low in 2009, the financial press has been looking for reasons why the bull market could be ending. As I noted in last week’s trading lesson Avoiding Bear Markets, neither the economic data nor the market’s technical outlook indicates an imminent bear market.
In addition to the fears over a summer rate hike, some are also now concerned that the Dow Jones Transportation Average has not made a new high since November 2014. Is this a legitimate concern for investors?
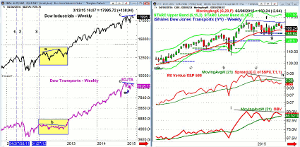
Chart Analysis: The weekly close only charts of the Dow Industrials and Dow Transports are the best way to indentify divergences between the two averages.
- In 2011, both averages made a new high in April, line 1.
- After a decline into June, only the Transports were able to make a new high in early July, line 2.
- This was followed by a sharp decline as the market finally bottomed in October.
- Both averages were in sync in early 2012, but then the Dow Industrials continued to make higher highs, line a, as the year progressed.
- In contrast, the Dow Transports made lower highs, line b.
- The Transportation average was not able to make a new high until early 2013 as the divergence between the averages lasted almost a year.
- Both averages made a series of higher highs in 2013 and for most of 2014.
- The Transports had a weekly closing high of 9198.20 on November 28.
- The Dow Industrials made another new high in 2015, line c.
- In contrast, the Transports have made lower highs, line d.
- This divergence is not a real concern unless the Transports have a weekly close below 8649, point e.
The iShares Dow Jones Transportation (IYT) was up a stellar 25.43% in 2014 but is down just over 1% so far in 2015.
- The weekly chart of the iShares Dow Jones Transportation (IYT) shows that it has been in a trading range, lines f and g, since last November.
- The quarterly pivot at $156.15 has been broken several times already in 2015 but not on a weekly closing basis.
- The lower close last week was just above the 20-week EMA at $159.03.
- Now a weekly close back above $164 could signal an imminent upside breakout.
- A completion of the trading range has upside targets in the $178-$180 area.
- The weekly relative performance dropped below its WMA in early January.
- It has stayed below its WMA with key resistance now at line h.
- The weekly on-balance volume (OBV) came close to the November highs, line i, in February.
- The OBV has now pulled back to its WMA, so this week’s close could be important as it will look much stronger with a higher close.
- The daily studies (not shown) are currently negative.
Next: Two Railroad Stocks to Watch
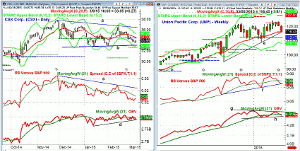
|pagebreak|CSX Corp. (CSX) was recommended in January as good support was identified in the $33.30-$34.30 area. The early February low was $33.02, line b.
- CSX was up 28.12% in 2014, but is currently down 4.86% in 2015.
- The daily trading range, lines a and b, has formed over the past three months.
- A strong close above the February high at $36.78 would complete the trading range.
- This would give upside targets in the $40-$42 area.
- The quarterly projected pivot resistance is at $42.79.
- The daily relative performance is still in a well defined downtrend, line c, and is below its WMA.
- The weekly RS line (not shown) is below its WMA but the monthly is still positive.
- The daily OBV is trying to turn up from support at line d.
- The higher lows suggest accumulation but an upside breakout is needed to confirm.
- The 20-day EMA is at $34.59 with the daily starc+ band at $35.26.
Union Pacific (UNP) has been a market leader for most of the bull market as it was up 44.1% in 2014. It has held up well in 2015 as it is up 1.41%.
- UNP has tested its 20-week EMA and monthly projected pivot support at $116.31 last week.
- The quarterly pivot is at $112.17 with the weekly starc- band at $108.88.
- The weekly RS line dropped below its WMA at the end of February.
- The RS line support at line f, is now being tested.
- The weekly OBV is also back below its WMA but above the key support at line h.
- There is important OBV resistance now at line g.
- The daily technical studies are negative and it would take several days before could turn positive.
- The initial resistance and the declining 20-day EMA is now at $119.61.
What it Means: The Dow Transports has a seasonal tendency to decline into the end of March before it rallies through early May. It forms a secondary high in July.
I think the strong jobs report will be followed by additional improvement in the economy, which should push the Dow Transports to new highs in the next few months.
Would stay with existing positions in the Transports and railroads as recommended in Time to Ride the Rails.
How to Profit: No new recommendation.
Portfolio Update: For the iShares Dow Jones Transportation (IYT) should be 50% long at $156.74 and 50% long at $154.16 (the 1/30 low was $154.02) with a stop now at $152.79.
For the CSX Corp. (CSX) should be 50% long at $34.27 and 50% long at $33.22 (the 1/30 low was $33.21). Use a stop now at $32.37.
For Union Pacific (UNP) should be 50% long at $121.04 and 50% long at $118.88 with a stop at $114.39.


