The close Monday has caused further concern over the market’s short-term trend, so MoneyShow’s Tom Aspray studies the charts of the market tracking ETFs that were previously recommended to see if now is the time to be more defensive.
Stocks opened strong on Monday, but by the middle of the day the rally stalled as most of the averages closed the day higher but near the day’s lows. Early in the day, the advancing stocks led the decliners by a 2-1 margin but on the close 1795 were up with 1350 declining issues.
Last week’s selling did cause some technical damage, and therefore, in Friday’s technical review I concluded that the action early this week would be important. The close Monday has caused further concern over the market’s short-term trend. A strong close above Monday’s highs is needed to keep the market’s short-term trend positive.
The Shanghai Composite dropped over 4% on Monday. The EuroZone markets rallied in early trading but are now generally lower. The S&P 500 futures are lower in early trading and a look at the daily charts explains why I think one should be more defensive regarding long positions in the market tracking ETFs that were recommended some time ago.
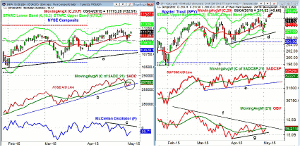
Chart Analysis: The NYSE Composite traded as high as 11,192 but failed to move above last Tuesday’s high at 11,204.
- The rising 20-day EMA is at 11,109 with more short-term support at last Friday’s low of 11,072.
- A drop below the 11,000 level should signal a decline to the 10,750-10,828 area and the quarterly pivot.
- This is about 3.3% below Monday’s low.
- The NYSE Advance/Decline line dropped below its WMA last week.
- It has now just rallied back to its WMA which has flattened out.
- A drop below last Thursday’s low will signal a further correction.
- The McClellan oscillator rose to -55 Monday but is still well below the zero line and resistance at line c.
The Spyder Trust (SPY) also closed weak (see arrow) as it was unable to hold its early gains on Monday.
- The still rising 20-day EMA is at $210.32 with last Friday’s low at $209.28.
- The uptrend, line d, is in the $207 area.
- A violation of this support makes the quarterly pivot at $204.90 the next likely downside target.
- This chart of the S&P 500 A/D line shows it made a new high Monday but that is not evident from other data sources.
- There is A/D line support at its WMA and last week’s low.
- The daily OBV has rallied slightly above its WMA and has short-term support at line g.
- The SPY needs to close above $212.48 to reassert the uptrend.
Next Page: Two More Market Tracking ETFs to Watch
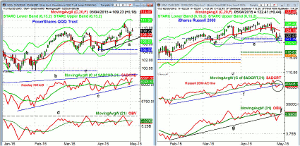
|pagebreak|The PowerShares QQQ Trust (QQQ) hit a high of $109.91 on Monday but failed to surpass the resistance at $110.07-$110.55.
- There is next support at $108.32 and the rising 20-day EMA.
- More important support now at last Thursday’s low of $107.07.
- The Nasdaq 100 has risen back above its WMA and still shows a pattern of higher lows.
- Support for the A/D line at last week’s low and then the uptrend, line c.
- The daily OBV has bounced from the support going back to the middle of March.
- A drop below this level would be negative.
- There is resistance for the OBV at line d, and a strong move above this level would be negative.
The iShares Russell 2000 (IWM) also reversed from the day’s high at $123.35 to close at $122.41.
- The declining 20-day is at $124.19 with additional resistance at $125.37.
- The Russell A/D line dropped below the prior low on Friday.
- This broke the uptrend, line f.
- The rebound Monday almost took the A/D line back to its now declining WMA.
- The OBV has also dropped sharply and broken the uptrend going back to the February lows, line g.
- On Monday, the OBV has just bounced back to barely above its WMA.
- This makes the close on Tuesday more important.
- On a drop below last week’s low of $120.66, the quarterly projected pivot support is at $116.83.
What it Means: The stock market’s dominant trend is still positive but the evidence is mounting that we may see a drop to stronger support, possibly even to the March-April lows in the Spyder Trust (SPY) before the major trend resumes.
Therefore, now, I think, is the time to take profits on half of our market tracking ETF positions and to raise the stops on the other half to just under the recent lows.
How to Profit No New recommendation.
Portfolio Update: Traders are 100% long the iShares Russell 2000 (IWM) at an average price of $115.92. Sell ½ the position on the open and use a stop at $120.77.
Traders are 100% long the Spyder Trust (SPY) at an average price of $200.50. Sell ½ at on the open and raise the stop further to $208.83.
For the PowerShares QQQ Trust (QQQ) should be 100% long at $106.73 sell ½ on the open. Raise the stop to $107.77.


