
Another strong market performance is needed to reassert the market’s uptrend, so while the short-term trend may still be in doubt, MoneyShow’s Tom Aspray feels a look at the more important monthly charts and technical studies can give one a better reading on the market’s long-term trend.
The high level of bearish sentiment and the high daily reading of the ARMS Index set the stage for Wednesday’s impressive rebound. The A/D ratios improved all day to close 3-1 positive. In the latest survey from AAII, the bullish % rose slightly to 27% but is still at relatively low levels and is well below the long-term average of 38.9%.
Does this mean the stock market’s uptrend has resumed? As I discussed Wednesday, another strong market performance Thursday and/or Friday is needed to reassert the market’s uptrend. The new all time high by the Nasdaq Composite is clearly a positive as was the new daily closing high in the Nasdaq 100.
Though the short-term trend may still be in doubt, a look at the more important monthly charts and technical studies can give one a better reading on the market’s long-term trend.
Click to Enlarge
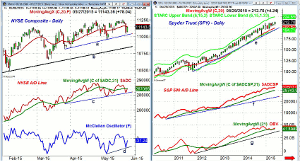
Chart Analysis: The daily chart of the NYSE Composite gives a closer look at the market’s short-term market trend.
- The support for the NYSE, line a, going back to the March lows, was tested Tuesday.
- A daily close under that low of 11,042 would reassert the downtrend.
- The daily starc- band is a bit lower at 11,015 with the weekly at 10,788.
- This also corresponds to the long-term uptrend, line b.
- The A/D line has closed back above its WMA after it tested support at line c.
- The McClellan oscillator closed at -116 Tuesday but rose to -31 on Wednesday.
- A strong move back above the zero line would be positive.
- The daily starc+ band is at 11,340 with June’s pivot resistance at 11,459.
The monthly chart of the Spyder Trust (SPY) shows that the long-term uptrend (line e), that connects the 2011 and 2012 lows, was tested last October.
- There have been tight ranges over the past three months with lows at $204.51 and $203.49 from April and March.
- The rising 20-month EMA is at $199.71.
- For June, the monthly projected pivot resistance is at $218.10 with the monthly starc+ band at $224.85.
- The monthly S&P 500 A/D line last tested its WMA in late 2012.
- The A/D line has long-term support at line f.
- The monthly OBV is back above its WMA but is still well below the November highs.
- The monthly pivot support for June is at $208.38.
Next Page: Two More Monthly Charts to Watch
|pagebreak|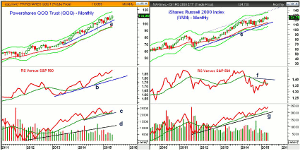
Click to Enlarge
The Powershares QQQ Trust (QQQ) has formed higher lows over the past three months and is up 7.71% YTD.
- There is important monthly support at $104.24 that also corresponds to the monthly uptrend, line a.
- The rising 20-month EMA is at $96.60.
- The daily starc+ band is now at $112.67 with monthly pivot resistance at $114.43.
- The monthly starc+ band is now at $117.21.
- The relative performance will make another new high in May.
- The RS last tested its WMA in April 2014.
- The monthly OBV moved back above its WMA in April, but is still below its all time highs.
- The OBV has initial support at line c, and it’s rising WMA.
- There is long-term OBV support now at line d.
- There is minor support now at $106.76 with June’s monthly support at $107.76.
The iShares Russell 2000 (IWM) is up 4.41% YTD so it is still doing better than the 3.94% gain in the SPY.
- IWM has short-term resistance at last week’s high of $125.47.
- It is still below the April high of $127.13 with monthly projected pivot resistance at $126.73.
- The monthly starc+ band is at $136.1.
- The relative performance has turned up but is still just below its WMA.
- The RS line has more important resistance at line f.
- The monthly OBV is very close to making a new high in May.
- The long-term trend is clearly positive with major support at line g.
- June’s projected pivot support at $121.50 represents first good support.
- The early May low was $120.24.
What it Means: The S&P futures are down 5.0 points ahead of the opening, but it is the close that is more important. A drop much below Wednesday’s low at 2101.25 would turn the focus back on the downside.
It may take another push to the downside to move the bullish sentiment to oversold extremes. As I noted last week, there are still 3 Reasons to Put Stocks on Your Summer Shopping List.
For my market comments and more charts during the day, you can follow me on either Twitter or StockTwits.


