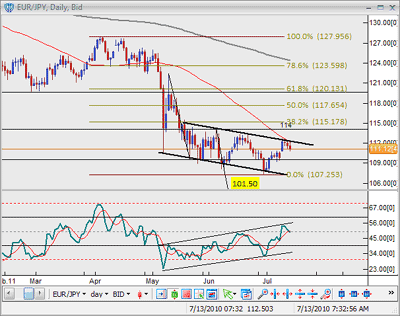
Daily: The daily chart shows the EUR/JPY respecting a declining channel resistance, as mentioned in previous updates. Also, there is a bullish divergence followed by a negative reversal, so another downswing can be expected.
The decline has so far been weak. We can see that combination of candles is a strong bullish candle followed by a doji and then almost two subsequent bearish candles. I say “almost” because today’s candle has not closed, but even if it did, you can see that it would close within the strong bullish candle last week.
More confirmation is needed for a reversal back into a declining channel.
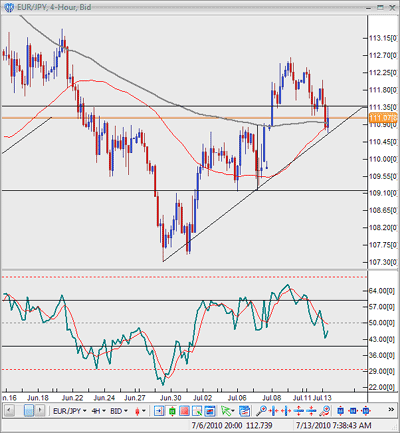
Four Hour: The four-hour chart shows the rally that has brought the pair from support to resistance of the channel.
The bearish outlook is premature because the market may be setting up for another rally. This week started with topping action and a decline has followed.
However, for the bearish outlook, the decline has to break below the rising support. So far, the market is respecting the trend line.
If the market closes below 110.50, it should signal a bearish attempt. The RSI should also break below 40. The 109.25 area is an important support seen in the daily as well. This should be the immediate target. If broken, the pair is looking at 107 and then 101.50.
One reason to believe the downswing to 101.50 may start now is because the market completed “ABCDE” waves within the channel, and therefore, may have completed the consolidation/correction pattern.
By the Staff at FXTimes.com
Find more currency articles at FXTimes.com


