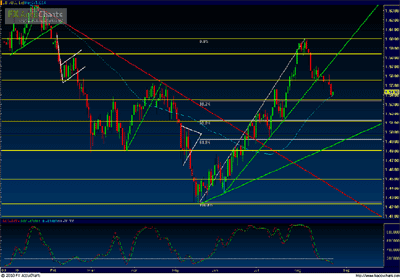
Price action on GBP/USD (a daily chart of which is shown) as of Wednesday (August 25, 2010) has hesitated after approaching key 1.5350 region support on the heels of almost three weeks of bearish price action that broke down below a key uptrend support line and just established a new one-month low for the pair.
(Price on first pane, Slow Stochastics on second pane; horizontal support/resistance levels in yellow; uptrend lines in green; downtrend lines in red; chart patterns in white; 50-period simple moving average in light blue.)
This strong support area coincides approximately with a 38.2% Fibonacci retracement level of the bullish trend run from the long-term low just above 1.42 to the high near 1.60. Currently, GBP/USD continues to carry a bearish bias.
In the event of a strong breakdown below this 1.5350 area support confluence on continued bearish momentum, price action could target further downside support in the 1.5120 price region, which also coincides approximately with a 50% Fibonacci retracement of the noted bullish trend run.
By James Chen, chief technical strategist, FXSolutions.com


