By Drew Shaw and Kyle McEwan of Lind-Waldock
The euro has been gaining ground on the US dollar amid speculation that the Federal Reserve may announce new quantitative easing measures. The dollar declined to $1.3639 per euro, the weakest level since April 15, 2010. If you are long the euro, you might want to let your position ride a bit longer. However, the euro is approaching some key resistance points, and Europe’s economy isn’t in better shape than the US economy, so caution may be warranted.
Currency traders will be watching for any interest rate changes or statements from the Bank of England and European Central Bank, which both hold their regular policy meetings on October 7. The current rate in the UK stands at 0.50%, and in the euro zone, at 1%. No changes are anticipated, but any statements in terms of asset purchases and/or the economy could be market moving.
The story in currencies is tied probably even moreso to the US, which has been struggling with a weak economy and lack of job growth. The September employment report will be released on October 8. A Bloomberg analyst survey shows the consensus forecast for a rise of 5,000 in non-farm payrolls, an improvement from a drop of 54,000 in August. The unemployment rate is anticipated to tick up to 9.7%.
Currency traders should understand the basic concept of purchasing power parity to determine whether a particular currency is over- or undervalued. It’s a theory of long-term equilibrium between exchange rates. Two of the same items should cost roughly the same in two countries, even though the exchange rates fluctuate.
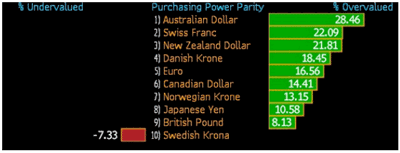
The graph below shows most currencies relative to the US dollar are overvalued based on purchasing power parity. Note that the euro is more than 16% overvalued. Europe has some structural difficulties and is perhaps in worse condition than the US. Keep in mind that purchasing power parity has some flaws, and is a long-term measure. It should not be used for short-term trading decisions, but is worth paying attention to.
Next: Key Technical Factors Surrounding Euro
|pagebreak|Technical Factors
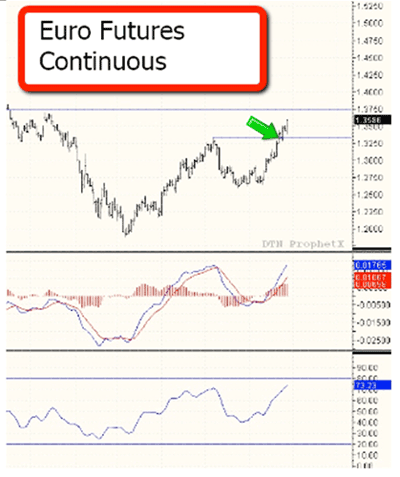
Many market technicians watch key support and resistance points. In the euro, traders were looking for a break of a prior high at $1.33 - $1.34, which was acting as resistance. You can see the breakout in the chart below, represented by the arrow. One of the next resistance levels is around $1.38 - $1.39.
The Moving Average Convergence/Divergence (MACD) is bullish, but the Relative Strength Index (RSI) is showing the market is nearing overbought conditions. The RSI is not too concerning.
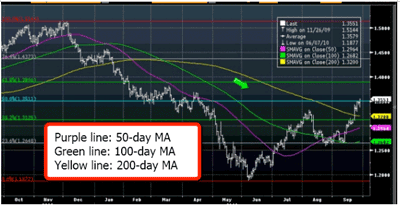
Among the advanced technical tools that analysts watch are Fibonacci retracement levels. We won’t go into details about the mechanics of Fibonacci analysis, but what’s important to note is a level at the two-thirds mark, or 61.8 percent, which is a key area technical traders pay attention to. It coincides with two tops, two prior resistance points, at $1.38 - $1.39. So it’s a good area to watch because traders might attempt to go short there and there would be some turbulence near that point.
The 50-day moving average has crossed the 100-day moving average in the euro, which is also significant to note. The euro rallied a week after.
The euro also broke through the 200-day moving average, the next bullish sign. If the 50-day breaks through the 200-day, that would also send the markets further still. We don’t think there is much stopping the euro from moving to $1.38 – 1.39 from a technical perspective.
From a fundamental perspective, however, a lot of market participants are anticipating quantitative easing measures that will push the US dollar down. That’s something that is being priced into the market right now. It would cause the euro and Canadian dollar to rise, and push up commodity prices. If you are long the euro, you probably can let it ride a bit longer, in our opinion, until this sentiment changes.
US Dollar Index
Many traders like to follow the US dollar index as a general barometer of the dollar versus other global currencies. It represents the dollar’s standing versus six major currencies, and the index hit an eight-month low on Wednesday, September 29. However, many don’t realize the index is heavily weighted towards the euro, which accounts for about 60%. So if you have a view on the US dollar and trade this index, you have to have a view on the European economy too. You are essentially playing the euro when you go long or short this index. There is also a 13% weighting in the yen, and smaller weightings in four other currencies. Whenever you are trading an index product, you will want to know what its components are.
In the US dollar index, watch key support at 72. If this level is breached, the US dollar could really have problems. This index is not very quick to move, so it could take some time. Both the euro zone and US economies are fundamentally flawed, so these moves aren’t going to be in a straight line. We are likely to see some back and forth, which will present traders with some great opportunities.
By Drew Shaw and Kyle McEwan of Lind-Waldock
Drew Shaw is a senior market strategist based in Lind-Waldock’s Toronto office and is serving clients in Canada. If you would like to learn more about futures trading, you can contact him at 877-840-5333, or via e-mail at dshaw@lind-waldock.com. Kyle McEwan is a market strategist based in Lind-Waldock’s Toronto office and is serving clients in Canada. If you would like to learn more about futures trading, you can contact him at 877-840-5333 or via e-mail at kmcewan@lind-waldock.com.


