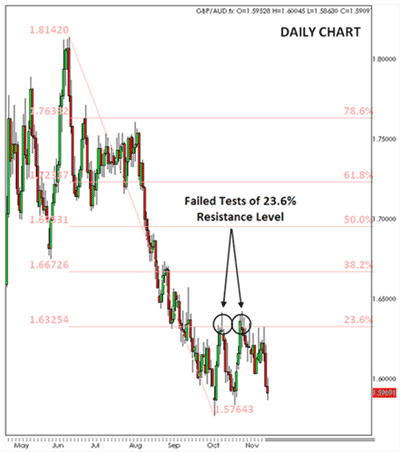
The second half of 2010 has not been kind to the GBP/AUD. Since retesting 2010 highs above 1.8000 on Independence Day, the pair has shed an incredible 2300 pips down to an all-time low at 1.5764. The pair briefly bounced this autumn, but failed to hold above the shallow 23.6% retracement of the summer’s drop. The pair is now dropping once again, and a retest of all-time lows appears imminent.
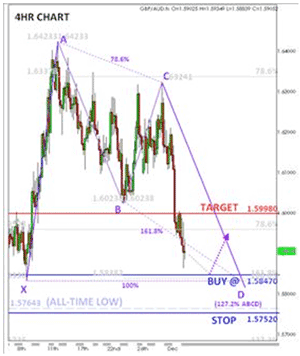
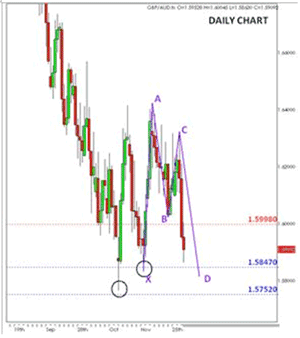
The recent drop (shown on the four-hour chart below) has created a bullish Gartley/double bottom formation projected to complete just above the key low at 1.5764. If prices continue to drop, we will look to buy off pattern completion, characterized by the following convergence of support levels:
- Double bottom at point X
- 161.8% of BC
3. 127.2% ABCD pattern extension
The stop for this trade will be set at 1.5752, below the all-time low. A conclusive break of this level would point to an increased probability of a strong bearish continuation down to the 127.2% and 161.8% XA retracements near 1.5650 and 1.5500, respectively.
Given the countertrend nature of the trade, we will look to take profits at 1.5998, representing a relatively conservative 38.2% retracement of the CD leg. If prices show strong bullish momentum through this level, we may look for a more aggressive target near the 1.61 level (a 61.8% CD retracement). Finally, while the relatively sharp decline in the CD leg (note how the prices are likely to hit our entry before the purple CD projection would suggest) typically indicates strong bearish momentum, the significance of the all-time low at 1.5752 counteracts this warning sign.
By Roger A. Stojsic, currency analyst, GFTForex.com


