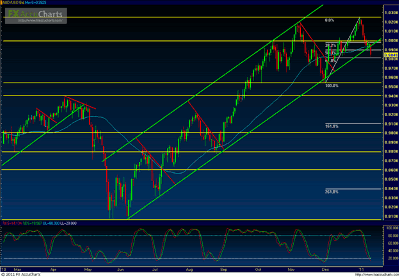
Price action on AUD/USD (a daily chart of which is shown) as of yesterday had dropped to break down below a key parallel uptrend channel extending back to the June 2010 lows.
On the chart above, price on the upper pane, slow Stochastics on the lower pane; horizontal support/resistance levels in yellow; uptrend lines in green; downtrend lines in red; chart patterns in white; 50-period simple moving average in light blue.
This price drop follows on the heels of a significantly bearish trend that has been in place since the beginning of the New Year last week.
This bearish trend originated from the multi-decade high around 1.0250 hit on New Year’s Eve 2010.
Currently, further bearish momentum on the uptrend channel breakdown could presage a change in trend for AUD/USD, with a key near-term downside target in the 0.9540 support price region.
Further downside target levels on potentially continuing AUD/USD bearishness are shown on the above chart, and include prior horizontal support/resistance levels and Fibonacci extension levels.
By James Chen, chief technical strategist, FXSolutions.com


