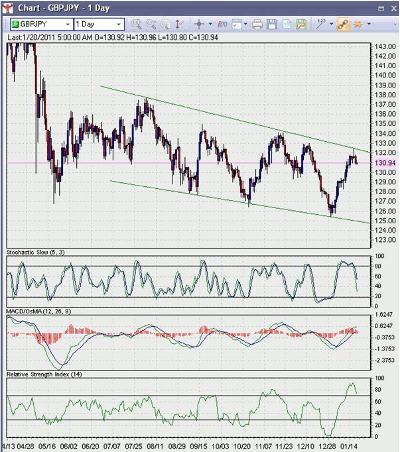
The long-term trading pattern on the GBP/JPY currency pair appears to reveal a distinctive bearish channel over the past six months.
The pair recently climbed to the upper border of this channel and now appears to be continuing within its range-trading behavior.
We can see on the chart below that the pair touched the range’s upper border and quickly bounced off of it.
The stochastic (slow, five-day) has a bearish cross, followed by a descending price movement, supporting the notion of a downward correction to this latest upturn.
The moving average convergence/divergence (MACD) also reveals what appears to be an impending bearish cross above the 0.0 line and the Relative Strength Index (RSI) is falling rapidly out of the overbought region.
All of these indicators support the notion of a bearish GBP/JPY with a short-term target at 129.00 and longer-term price targets near 128.00 and 125.00 over the coming months.
By the Staff at CountingPips.com


