The volatility of the EUR/CAD pair continues to be affected by the volatile forex market. The last two weeks have seen a lot of bullish strength in the EUR/CAD pair.
However, as I demonstrated below, it seems that the pair’s bullish run may have run out of steam, and a bearish correction could soon be underway. This might be a good opportunity for forex traders to enter the trend at a very early stage and at a great entry price.
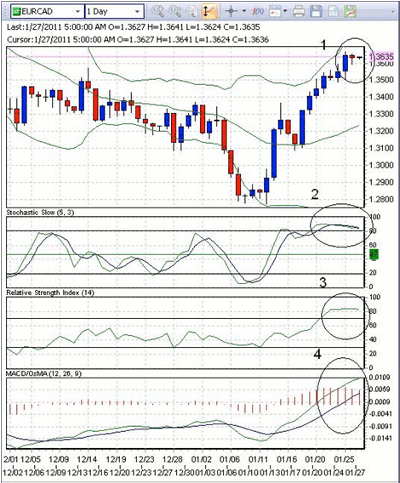
Below is the eight-hour chart of the EUR/CAD currency pair. The technical indicators that are used are the Moving Average Convergence/Divergence (MACD), Relative Strength Index (RSI), and Slow Stochastic.
Point 1: There is a doji candlestick that has formed on the chart, indicating that a reversal should take place
Point 2: The Slow Stochastic indicates a bearish cross, signaling that the next move may be in a downward direction
Point 3: The Relative Strength Index (RSI) indicates that the price of this cross currently floats in the overbought territory, signaling downward pressure
Point 4: The MACD indicates an impending bearish cross, signaling that the next move may be in a downward direction
Keep in mind that signals such as those mentioned above do not always mean an immediate change will happen in the following candle. It may take days for the chart to work itself out and head in the direction the signals portend.
Technical analysis is both art and science. The more signals that present themselves, the more confidence you can have that the pattern will play out.
By Anton Eljwizat, contributor, CountingPips.com


