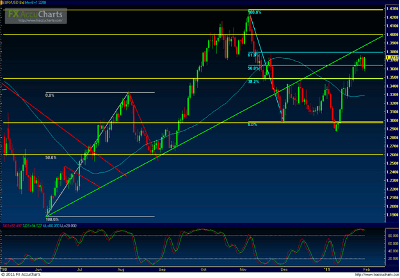
Price action on EUR/USD (a daily chart of which is shown) as of Monday (Jan. 31) has recovered much of the losses suffered on the last day of last week, when the pair made a corrective drop after hitting a high at 1.3756.
In the chart below, price is on the top pane and a “slow stochastic” indicator is on the bottom pane. Horizontal support/resistance levels are shown in yellow, uptrend lines in green, downtrend lines in red, and chart patterns in white. A 50-period simple moving average is shown in light blue.
As long as a breakdown below key support at 1.3500 does not occur—and it hasn’t as of yet—the short-term uptrend that has been in place for the last three weeks should continue to be intact.
In the event that price action continues this entrenched uptrend with a breakout above 1.3800 resistance, the key 1.4000 psychological level should serve as the next major resistance target to the upside.
Downside support within the context of the current uptrend continues to reside around the important 1.3500 support/resistance price region.
By James Chen, chief technical strategist, FXSolutions.com


