
The dollar index has formed a triangle consolidation near critical support, but conflict in the Middle East has made this a primarily news-driven market.
The US dollar index continues to flirt with a long-term (three-year) trend line and critical support level that traders are watching very closely.
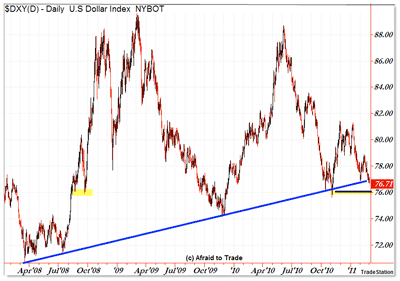
Let’s take a moment to look at this trend line and level as it currently stands in the dollar index:
Daily Chart Analysis – US Dollar Index
Click to Enlarge
We’re seeing the US dollar index ($DXY) on the daily scale (though a weekly would work just fine) from the early-2008 bottom (just after the stock market peak) to the present new highs in the S&P 500 (made last week).
This long-term trend line touches about six swing lows, including the major inflection low/pivot from December 2009.
The index interacted with this level twice in 2010 and again recently in January, and technically, we’re sitting right on (or just below) the blue trend line as we start March trading.
The next potential support zone to catch price would be the simple $76 index level, which drew in support in November 2010 and twice did so around August/September 2008.
A breakdown under the $76 support sets up a play for the 2009 low near $74.20, and deterioration below that could send the index back down to the 2008 levels, but let’s not assume that is the only pathway until we start breaking immediate levels right here.
Though the upper trend line isn’t as clear, there’s a declining trend line that ends above the $80 index level.
That means that chart-wise, we have a triangle consolidation in the US dollar index, and that’s how we should define the trend until proven otherwise: Sideways/flat/consolidating.
A support bounce—one that would likely be bearish for stocks and commodities—likely sends the index back to the $80 index level, though further deterioration beneath $76.70 to $76 and down to perhaps $74 would likely be bullish for stocks and commodities.
Keep in mind that Middle East tensions have temporarily shifted the classic intermarket relationships between oil and other commodities and the US dollar. It’s a news-driven market at the moment.
Whatever play you devise in the cross markets, keep a close watch on current trend lines and the $76 level immediately for the US dollar index.
By Corey Rosenbloom, trader and blogger, AfraidToTrade.com


