This multi-part article series concludes with a study of Chinkou-Span, or “The Filter,” which is an additional method by which traders can get valuable confirmation of signals on the charts.
In the previous two articles on Ichimoku, we looked at the crossover of Tenkan and Kijun (referred to as trigger and base lines, respectively), as well as “Kumo,” or “The Cloud.”
In this piece, we’re going to incorporate the final element of this exciting indicator known as Chinkou-Span, or “The Filter.”
“The Filter,” as I call it, can work similarly to Kumo in that it can help us determine the strength of the signal taking place from the trigger/base line crossover.
Chinkou-Span (referred to from here on out as “The Filter”) is just current price plotted 26 periods ago. That’s it. No scientific calculations or complicated mathematics required. It’s just an iteration of current price plotted 26 periods late.
The value of The Filter is in showing where current price action is in relation to where price action was 26 periods ago. If price of the current candle is higher than price was 26 periods ago, that is generally looked at as being bullish.
If price of the current candle is lower than price 26 periods ago, that is generally looked at as being bearish.
Let’s walk through a couple of examples to see how traders are using The Filter in their trading decisions.
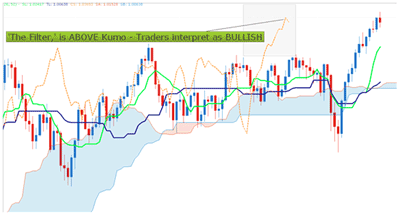
In the example below, notice that a bullish crossover has just taken place above Kumo.
If you remember from the last lesson, we learned that this is a long signal that traders would generally interpret as being very strong due to the agreement between the crossover and the location of price with respect to Kumo.
Now that we can incorporate The Filter into the strategy, we can observe that this long signal is potentially even stronger that we may have initially thought because it’s confirmed by the fact that The Filter is above price action from 26 periods ago.
This indicates that the trend may be very strong to the upside and very conducive for long positions. Traders could interpret this signal as being extremely strong, as there is now Kumo and Filter confirmation of our bullish signal.
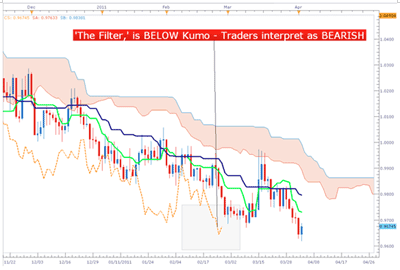
The exact opposite would be the case for short positions. Bearish crosses of trigger/base lines beow Kumo are made even stronger with confirmation from The Filter being below price action 26 periods ago.
Let’s look at an example where The Filter could potentially keep us from entering into positions we may not want.
Article Continues on Page 2
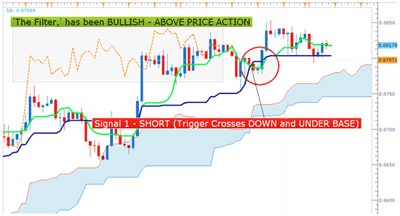
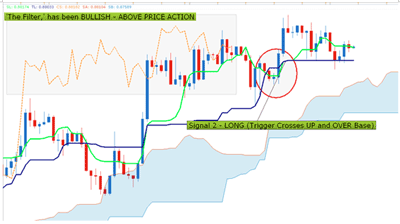
|pagebreak|In the chart below, notice that there are two trigger/base line crossovers taking place above Kumo.
Observe the first signal, which would have been a bearish signal, as the trigger has crossed down and under the base line.
This takes place above Kumo, and The Filter is also above Kumo, both indicating bullishness.
The bearish signal we have just received disagrees with the bullishness we are seeing on both Kumo and The Filter.
And, as you can see from the chart, choosing to go short here wouldn’t have worked out too well.
However, if you notice signal 2 taking place shortly after, you will see that we have a bullish cross as the trigger crosses up and over the base line.
On Signal 2 we have agreement: The bullish crossover agrees with the bullish state of Kumo (price is above Kumo), and The Filter residing above price action at the time of the signal. Traders would consider this long buy signal to be extremely strong, as there is agreement between the signal, Kumo, and The Filter.
Because The Filter is built 26 periods behind current price, manually backtesting this part of the indicator can be challenging. However, one way that traders often become more familiar with The Filter is by forward testing on demo accounts, and setting the size of the lot traded based on how strong the signal was.
In summary, here are the signals and how they would help you determine position size.
On bullish crossovers:
- Below Kumo; The Filter below price 26 periods ago: Weak signal (1 lot)
- Crossover taking place between Kumo; Filter in Kumo: Moderate signal (2 lots)
- Above Kumo; The Filter is above price 26 periods ago: Very strong signal (3 lots)
On bearish crossovers:
- Above Kumo; The Filter above price 26 periods ago: Weak signal (1 lot)
- Crossover taking place in Kumo; Filter in Kumo: Moderate signal (2 lots)
- Below Kumo; The Filter below Kumo: Very strong signal (3 lots)
By James Stanley of DailyFX.com

