Part 3 of this article series discusses setting stop levels and profit targets based on the application of Fibonacci analysis, highlighting common misconceptions and mistakes to avoid.
Continued from Part 1 and Part 2
At this point, only half the battle—if that—is over. What about the profit targets? Well, much like our entries and stops, our limit should also typically be based on support or resistance. This gives a trader a logical point at which to exit the market.
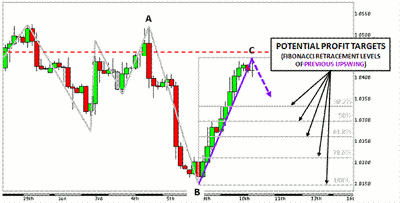
In this example, we will use the same Fibonacci analysis based on the rally (swing, or trend) prior to our completed doji to calculate potential levels of support where the projected reversal may stop and change directions.
It’s important to remember that levels of support and resistance act as “zones,” and prices may fall just a bit short of, or just pierce, these levels. In other words, traders may want to allow for a cushion just above or below Fibonacci levels.
In this example, we’re anticipating the market to move down, so we may want to set profit targets just above the Fibonacci levels in case the market doesn’t quite reach the actual line we see on the chart. (When setting stops, traders will typically allow for a cushion just beyond a level of support or resistance, providing a bit of room in which the market may pierce that exact level.)
No matter how experienced a trader may be, no one knows for certain what the market will do next, or how far the market will go. This explains why some traders may choose to have multiple profit targets.
One age-old trading mantra says, “Cut your losses quickly, and let your profits run.” Although this is an excellent piece of advice it is often misinterpreted and can actually do some serious damage.
A trader must “let profits run” to logical profit targets, which generally reflect levels of support or resistance, depending on the direction of entry. This is where trend analysis plays a significant role in helping to determine which profit targets, or how many, a specific trade calls for.
The mistake for most traders is the fear of “getting out too early,” and as a consequence, greed may oftentimes set in. This often leads to giving those profits back, and in many cases, turning a winning trade into a losing trade.
Multiple profit targets tend to lead to more complicated exit strategies for which stop management becomes essential. One key aspect of successful trading that will help to determine the quality and probability of a trade is the risk/reward ratio. In my opinion, this is without question the single-most- important factor of a high-quality trade.
See video: Make Sure Risk/Reward Is on Your Side
NEXT: "Unbreakable" Rules for Setting Stops and Profit Targets
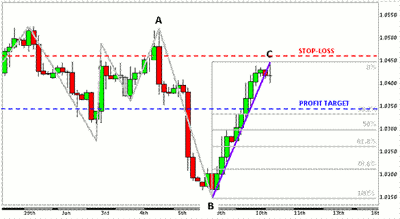
|pagebreak|For now, let’s just keep it simple and see what this trade set-up looks like using the same USD/CHF example. We will assume the most conservative profit target (set just above the 38.2% Fibonacci retracement level and adding four pips for the spread).
Now that we have determined our exits before entering the market, we will be able to perform the two absolutely essential components of proper risk and money management.
One of my unbreakable rules is to always determine both entries and exits in advance so that two key elements can be defined: 1) Risk/reward ratio, and 2) Amount of risk on the trade. The risk/reward ratio, in many cases, will be the determining factor of whether or not the trade is initiated based on the traders’ winning percentage.
However, most traders do not know their true winning percentage for one of two reasons.
- Lack of Consistency: Most traders do not follow the same rules, if any, each and every time they place a trade. This makes it impossible to determine with any degree of accuracy what the true performance is because of the constantly changing variables. Most place several trades, and then “try” something else, which brings us to the next point…
- Insufficient Sample Size: Simply not enough trades have been placed to accurately determine an average winning percentage. This is where the mathematical law of large numbers comes into play. This law basically states that the more occurrences you have of a specific event, the closer you will come to the true probability of that event reoccurring.
Trading is all about probabilities, not certainties. So an understanding and application of this law is essential. Think about flipping a coin ten times and getting eight heads. We all know that the odds of flipping a coin are 50/50, so no one in their right mind would assume there’s an 80% chance of getting heads based off those ten initial flips. So when dealing with proximity, the law of large numbers basically means the more flips you have, the closer you get to that 50/50 average we know exists.
Even after 100 flips, you may still not see a true representation of those odds because somewhere along those 100 flips, you may see ten heads or ten tails in a row. This is where the law of averages comes into play.
Since we know the odds are 50/50, that suggests that if we see ten heads in a row, somewhere down the line, we’ll probably see ten tails in a row to average out the 50/50 probability.
The funny thing is, let’s say someone sees 20 heads flipped in a row. How many people do you think would be willing to bet money that the next flip is going to be tails? They’re probably thinking to themselves, “Wow, 20 heads in a row; what are the odds? The next one has to be tails!” But in reality, the odds are always 50/50 no matter how many heads or tails appear in a row.
More tomorrow in Part 4.
By Roger A. Stojsic of GFTForex.com


