This trading case study provides useful insights on trading gaps and fills on the charts, as well as shows the power of the Fed to move the markets when interest rate decisions are announced.
As much as I like to write about current aspects of forex trading in my articles, my favorite kind of lesson topics are when they deal with actual events that have happened in the past because history always repeats itself. Typically, the day-to-day actions of the markets present their own lesson in a unique way, and we can learn much from these important occasions.
This week, I would like to take a look back at the Federal Open Market Committee (FOMC) statement (Federal Reserve interest rate announcement) from September. These news days typically cause plenty of commotion in the market, and I usually have better things to do than try to get involved in trading the news, as it can often be erratic and difficult to trade.
See related: Why Traders Should Ignore the News
However, I do have exceptions to the rule, particularly when I am presented with a unique trading opportunity that fits my trading plan. I choose to focus my reasons for entering trades purely on the concepts of supply and demand. The chart will always tell me what I need to know if I study it in a truly objective fashion. In this case, let's take a look at the EUR/USD in recent trading action:
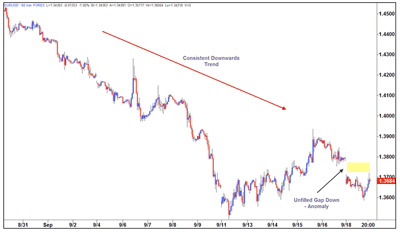
A few days before the FOMC statement, we can see that the EUR/USD was in a consistent downtrend making lower highs and lower lows. In fact, the momentum and sentiment was so strong that a gap down around 100 pips was created on the September 19 opening.
However, gaps are two-fold in nature, as they can create very low-risk trading set-ups, but they can also inhibit market price movement as well. You see, I find it useful to think of a gap in any market as something like an anomaly. It shouldn't really be there-like a spanner in the works or a blockage in the pipes-and if it is left untreated, things will not be able to continue working in the way they should.
In the case of the markets, we need to understand that a gap up is really representative of an abundance of demand, and a gap down is really just formed as a result of an overload of supply.
When imbalances are this strong, they create these huge levels where price literally gaps down or up, but they are now vacuums of nothingness where price never really traded. Much like the blockage in the pipes or an air bubble in your heating system, the market is now unable to function correctly until the anomaly or imbalance has been removed. This is what I call "bleeding the system."
So, how would we apply this dynamic to the above example?
Article Continues on Page 2
|pagebreak|Well, first, we should recognize that the gap down itself around the 1.3780-1.3810 area represents a pretty healthy, low-risk, high-reward trading opportunity in a truly objective area where supply was undoubtedly greater than demand.
It should also be noted that if we were looking to sell EUR/USD in this area, we would also be going with the current downtrend which the market had been exhibiting at the time.
See related: Best (and Worst) Gap Trading Set-ups
With these two very simple and logical facts in place, we simply wait for price to reach our entry area and take the trade as planned. This can be a simple enough approach for some, but for others, it can be one of the most challenging aspects of trading.
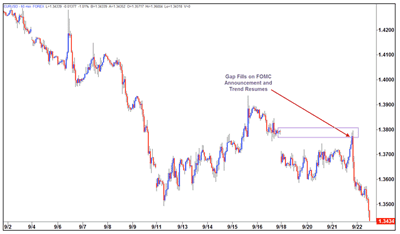
If we look at the above chart again, we can clearly identify the downtrend and there can be a strong desire to enter the trade early, simply out of fear of missing out on the trade, but we need to ignore this emotional way of thinking and remember that from a logical point of view, this market will have a far better chance of resuming its downtrend after it has corrected the anomaly created by the supply gap.
Interestingly enough, the market failed to close this gap for a couple of days after creating it and just drifted in a range-bound fashion, right up until about five minutes before the big FOMC statement. When the actual news was released, price spiked up into the supply area, filling the gap, and then resumed its downtrend as normal.
While it could have been seen as being a higher-risk trade because the entry was triggered on the release of the FOMC statement, I have learned over the years that even the biggest news releases will only push prices up or down to the nearest quality level of support or resistance in a much shorter amount of time. I am more concerned with finding the most objective levels to enter my trades, rather than focusing on when they are triggered.
As it turned out, the FOMC statement that day proved to be something of a big day for the markets fundamentally, with Ben Bernanke stating that he would be buying $400 billion in Treasury securities in the longer-term range and simultaneously selling an equal amount of short-term (three year or less) securities by the end of June 2012.
The action was in light of his statement that there are "significant downside risks to the economic outlook, including strains in the global financial markets." Tell us something we didn't already know, Ben!
I hope this helps you find opportunities around future FOMC announcement days.
By Sam Evans, instructor, Online Trading Academy


