
The latest COT report shows record pessimism against the euro, but bears may have to withstand a possible short-covering rally in the short term as well.
Euro bears are out in full force. According to the most recent Commitment of Traders (COT) report from the Commodity Futures Trading Commission (CFTC), speculators in the futures market have built their largest euro (EUR) short position since May 2010. The one-sided positioning highlights the market’s pessimism against the EUR, but also brings the possibility of a short squeeze.
The risk is for a bout of short covering to shake out weak EUR shorts before another move lower.
US Dollar: Housing Continues to Weigh on GDP
The US dollar (USD) caught a bid following the death of North Korean dictator Kim Jong II and news of increased tensions on the Korean Peninsula. Tuesday’s building permits and housing starts were forecasted to be flat, which underscored the slow recovery in the US housing market. [Better-than-expected reports on building permits and housing starts spurred stocks to a sizable rally yesterday – Editor.]
Wednesday’s existing home sales will also shed some light on a sector that has been a drag on US GDP. The USD may lose its recent appeal should we have better-than-expected housing data, which would contribute to an improved risk sentiment.
Liquidity is beginning to tighten as the Christmas holiday approaches, with short-term moves running a bit further. While the major FX pairs remain trading within their recent ranges, reduced liquidity has the possibility of triggering stops for those traders who look use tight protective stops.
Euro Pessimism Reaches New Highs
EUR bears are out in full force. According to the most recent Commitment of Traders (COT) report from the Commodity Futures Trading Commission (CFTC), speculators in the futures market have built their largest EUR short position since May 2010.
As of last Tuesday (Dec. 13), speculators were holding -116,000 contracts short, up from -95,000. The one-sided positioning highlights the market’s pessimism against the EUR, but also brings the possibility of a short squeeze.
The risk is for a bout of short covering to shake out weak EUR shorts before another move lower.
European sovereign credit downgrade rumors have kept the pressure on the EUR, and open discussion for a nation to leave the EU by European Central Bank (ECB) President Mario Draghi did not support the 17-nation currency.
Draghi told the Financial Times that the exit of an EU member would face greater economic pain outside the monetary union than if a nation stayed within the friendly confines. These comments were likely directed towards Greece.
The ECB continues to operate in the bond markets to support fiscally pressured nations with its bond- buying program, which purchased EUR 3.361 billion last week, up from EUR 0.635 billion two weeks ago.
The central bank has also provided almost unlimited liquidity to banks via the new long-term refinancing operations (LTRO), though the ECB has stopped short of unlimited bond purchases.
It is notable that the US/German two-year spread has now turned negative, setting a new record low. This means Germany can now borrow at a lower rate than the US for two years.
The two-year US Treasury note/bund yield spread has done a good job of tracking the EUR/USD, as the spread reached a peak of 134 basis points (bps) on May 4. Interestingly enough, this was the same day the EUR peaked versus the USD at 1.4938.
The two-year spread currently stands at a record low of -2 bps, while the EUR/USD is just above the 1.30 level. EUR/USD support is found at the 2011 low of 1.2870, while resistance is located at the October 4 low of 1.3140.
NEXT: Economy Calendar Stacked with Canadian Data
|pagebreak|Economic Calendar Stacked with Canadian Data
In contrast to the US, this week’s economic calendar is stacked with Canadian data releases. Tuesday would bring CPI data, and the core data is expected to fall to 0.2%, while the headline number should remain steady at 0.2%.
On Wednesday, we will get retail sales data, while the highlight will come on Friday in the form of monthly GDP data.
Canadian data for November was generally stronger, in line with better US data. However, during the month of December, the two nations’ data releases have diverged, with the US continuing to post better numbers while Canada has disappointed on a number of points, the most notable being employment and manufacturing data.
The USD/CAD continues to move higher and has resistance at 1.0460 from the trend line off of the October and November highs. Support is found at 1.0110 from the August uptrend. Versus the EUR, CAD has fared better, as the EUR/CAD continues to test the September lows of 1.3400. A break here would expose this year’s low of 1.2985.
Crude Oil Prices Flat on Korean News
Surprisingly, spot crude oil did not find a bid following the death of North Korean dictator Kim Jong II and news of increased tensions on the Korean peninsula. The price of spot crude oil failed to reach above $95. Perhaps the risk-off environment, the threat of additional European sovereign credit rating downgrades, and a stronger USD are weighing on the commodity.
Spot crude oil prices have resistance at $95 from the November 25 low and may have made a tweezer bottom at $92.50.
Technical News
EUR/USD
On a weekly basis, the EUR/USD broke some important technical barriers, closing below the rising trend line from the January and October lows. The weekly close at 1.3045 was also in line with the 61% Fibonacci retracement from the 2010-2011 bullish trend.
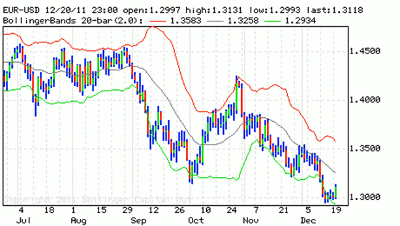
Click to Enlarge
While weekly stochastics are currently oversold, the monthly stochastics may have room to run lower. The January low of 1.2870 is the near-term support, with additional support coming in at 1.2665 from the monthly chart off of the 2008 and 2010 lows.
Resistance is back at 1.3140 and the 20-day moving average of 1.3275, followed by the December high of 1.3550.
GBP/USD
Sterling has consistently been sold at previous resistance levels, and with falling weekly and monthly stochastics, this strategy could remain intact. Initial support is found at Friday’s high of 1.5560, and the pair may have scope back to the range between the 55-day moving average at 1.5740 and the late-November high of 1.5775.
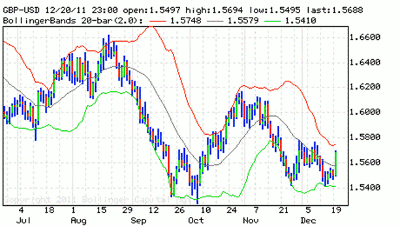
Click to Enlarge
Any rally could be capped at 1.5890 from the falling trend line off of the August and October highs. The test for sterling shorts will come at the October low of 1.5270. A break here may find support at the trend line stemming from the January 2009 low, which is found at 1.5100.
NEXT: USD/JPY, USD/CHF, and a "Wild Card"
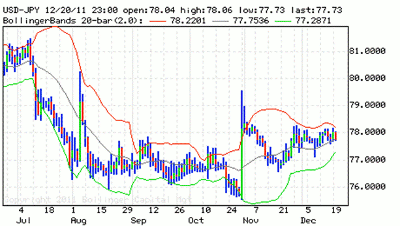
|pagebreak|USD/JPY
The USD/JPY is encroaching on its trend line from the 2007 high, which comes in at 78.30.
Click to Enlarge
Weekly and monthly stochastics are both moving higher, and a break above the trend would expose the post-intervention high of 79.50 and the August high of 80.20. A failure to make a significant close above the trend line could have the USD/JPY testing the December low of 77.50 and the November low of 76.55.
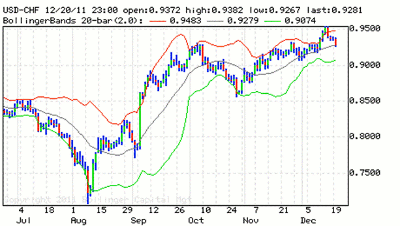
USD/CHF
Last week’s break above the 0.9330 resistance opens the door to this year’s high of 0.9782, as well as the December high of 1.0065.
Click to Enlarge
The falling trend line from 2003 comes in at 1.1165 and makes for a long-term resistance level. To the downside, 0.9330 will now act as a support, followed by the late-November low of 0.9065, and the 200-day moving average at 0.8925.
The Wild Card
USD/SEK
Tuesday, the Riksbank is expected to lower interest rates by 25 bps. Surprisingly, the USD/SEK has been unable to sustain a bid above the September high near 7.0000.
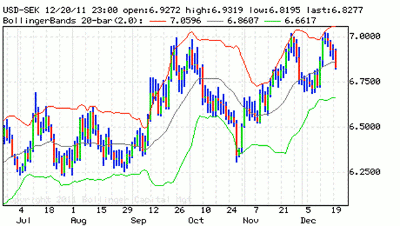
Click to Enlarge
Forex traders should note the 50% Fibonacci retracement of the 2010 high to the 2011 low rests at 7.0500. Support is found back at the December low of 6.6890.
By the Staff at ForexYard.com


