
The MF Global scandal is the most recent example of how quickly disaster can befall unknowing forex traders. Here’s how to keep tabs on your broker and spot early warning signs of financial troubles.
A very disturbing series of events has inspired this article. By now, all traders have heard about the disaster that occurred at MF Global. At the time of this writing, the outcome of this mess was unclear, as was the exact cause of it.
The basics are that the company "invested" otherwise un-invested client money in a basket of European bonds at a highly leveraged level. While buying a bunch of beaten up bonds for the high yield and potential upside in appreciation isn’t a horrible idea, overleveraging someone else’s money should be a crime.
There were hundreds/thousands of traders who had no access to the money in their accounts. In addition, many who had purchased fully-paid-for silver and gold physical metals through MF Global and held that metal in a repository are now prepared to have those holdings cut by over 25%. Scary stuff, isn’t it?
This kind of thing isn’t unique to MF Global, either. Several years ago, a company called REFCO had a similar disaster happen to their customer accounts. Check out Wikipedia for the entire history, but the bottom line is the company was hiding hundreds of millions of dollars in bad debts from regulators and the investing public, and when this information came to light, the company declared bankruptcy.
Many traders (myself included) lost a significant portion of their trading accounts and didn’t receive the reduced balance until months later.
This now leads me to how we can protect ourselves and our trading accounts from a potential disaster like this. The first thing I want to look at is the share price of the company’s stock. The way I see it is that large, professional institutions may invest in my brokerage firm’s stock, and if they seem to be exiting the stock, they may have figured out that there is something wrong.
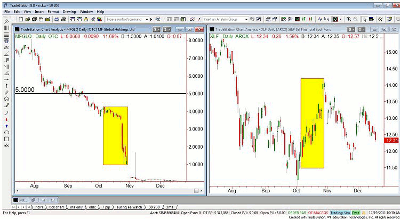
Click to Enlarge
In this pair of charts, MF Global is on the left and the Select Sector SPDR - Financial (XLF) is on the right. The charts looked very similar from August until the first week in October. XLF then proceeded to rally as MF Global’s stock accelerated to the downside. This should have been a huge warning that something was wrong with MF Global.
NEXT: 2 More Warning Signs to Watch for
|pagebreak|Another indicator is the actual stock price. It is common information that many investment firms won’t hold on to a stock after it trades/closes below $5 for a certain number of days. This rule is built into their disclosures.
Using the $5 threshold as a guide, you may have considered exiting MF Global in September. If you were using the comparison to XLF, you had nearly a three-week alert of the upcoming issues with the company.
Any doubts about the $5 threshold? Take a look at a Citigroup (C) chart. The company did a reverse split in May 2011 to get their stock price above $5. It was trading around $4.50 and did a ten-for-one reverse. This means that if you had 1,000 shares priced at $4.50, you now have 100 shares priced at $45. The dollar value of your investment remained the same.
The company was hoping institutional money would come in and buy the stock now that it is priced over $5. How is that working for them? All they did was give short sellers a better price to hammer the stock lower. At the time of this writing, the stock is trading below $25 on a split-adjusted basis, or below $2.50 on a pre-split basis!
So, what do you do if your forex brokerage firm isn’t publicly traded? Well, you could use your Master’s in Accounting degree and dig through the company’s financial statements to discover any weaknesses. But if you neglected to get that degree (like me), you could take a look at their information on the CFTC Web site. Here is the direct link.
Please concentrate on the three columns F, G, and H. These are the adjusted net capital, net capital requirement, and excess net capital. The way I look at it is that each company has a required amount of net capital. Depending on what they do for a living, the amount of customers, etc., these things will determine this figure.
What I am focusing on is the trend of the firm’s excess net capital. Excess net capital is the amount over and above what they are required to have. If your brokerage firm’s trend is down, be careful, because it can mean they are getting financially weaker.
Looking at ABN Amro, the first company on the list, you will see that their net capital excess for the months May through October fluctuated, but trended somewhat higher (89mm, 108mm, 131mm, 98mm, 111mm, and 119mm).
If your brokerage firm was trending like, for example, 47mm, 40mm, 33mm, 20mm, 16mm, and 6mm, you would be led to believe that their financials may be deteriorating. Because I am hyper-sensitive to having my brokerage account being stolen from me because of my REFCO FX experience, I would move my account.
My main recommendation is to be diversified in not only your investments, but also your brokerage firms. It wouldn’t be a bad idea to have several bank accounts at different national banks/credit unions as well. Always better to be safe than sorry!
By Rick Wright, instructor, Online Trading Academy


