Jeremy Wagner of DailyFX.com explains how to enter and exit strongly trending currency pairs like the EUR/NZD using either a retracement or breakout strategy.
There are two common ways a trader can enter into strong trends:
- Retracement strategy
- Breakout strategy
This article will explain how traders can enter and exit a strong trend using a retracement strategy. The second half will explain how traders can enter and exit on a breakout type of strategy.
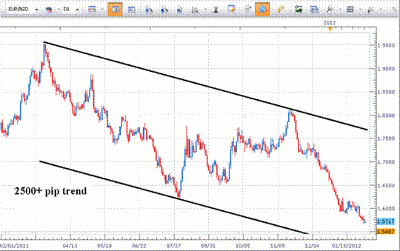
The EUR/NZD is one of the strongest-trending currency pairs over the past 11 months. The pair has moved about 2500 pips since mid-March 2011. This 20% move in foreign exchange is a huge move. As the sovereign debt problems in Europe continue, the EUR reaches towards all-time lows against the NZD.
This week is a big week for the euro and may create some additional volatility in the currency. Greece (was) in the midst of deciding whether to accept bailout funds in return for deeper austerity measures. The announcement of the decision was previously scheduled, but (was being) pushed back by Greece.
The market had priced in some type of haircut on Greek debt, so the acceptance of the bailout funds likely will have the euro rally, as that means there is a greater likelihood of debt obligations being met.
However, the delay in the announcement created uncertainty, which markets generally don’t like. Since the USD is sensitive to the risk on versus risk off trades, look to trade a cross pair such as the EUR/NZD, which strips out the USD exposure. As a result, we can match a relatively weak currency (EUR) against a relatively strong currency (NZD). We will look to sell the pair while it is in a strong downtrend.
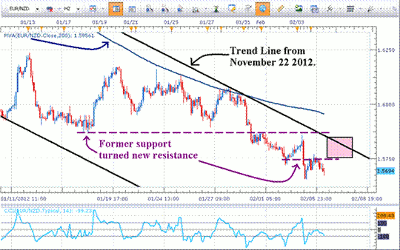
As we can see above, the EUR/NZD is near trend line resistance (black line). Additionally, we have a pink box defined by the two purple lines. These two lines (purple) were drawn based on former horizontal support levels. When the purple lines were originally broken, it created new resistance levels.
If you employ a retracement strategy, look for prices to bounce up and retrace into the pink box. The pink box is bound by 1.5873 on the top side and 1.5750 on the bottom side. You can confirm the trade with an oscillator (like MACD, RSI, Stochastic, and CCI), so if it curls down from overbought levels, then enter the trade.
Place a stop just above the swing high. In this case, I would like to see prices turn down before reaching the high of the pink box. Therefore, my stop loss would be near 1.5890.
See related: How to Place an Objective Stop Loss
Since the pair is trading at all-time lows, it has room to run if the trend continues. The bottom side of the daily channel is near 1.5000, so I would look for significant support to develop near 1.5000. Since this support level is several hundred pips away, I would move my stop loss to break even if prices trade below 1.5650.
Recently, prices did push into the resistance retracement zone. Therefore, retracement traders may be inclined to enter a position based on selling at resistance.
However, in our DailyFX Plus Webinars, we frequently hear from traders who are apprehensive to place entries into the market because they fear the unknown price movements into the future. What if the strong trend ends?
NEXT: The Forex Breakout Strategy
|pagebreak|That is a common emotion felt by many traders. Utilizing a breakout strategy can help alleviate some of those pressures as you let the market dictate to you if it is ready to resume the trend.
A breakout is simply selling at support and buying at resistance. There are many different ways of determining support and resistance. Today, we will look at a simple method of identifying entry and exit points by using the Donchian Channel Indicator.
Here is a summary of the rules to the strategy.
- Filter your trades in the direction of the daily trend. We determined in Monday’s report that this trend is a strong one to the downside. Therefore, we will look to sell
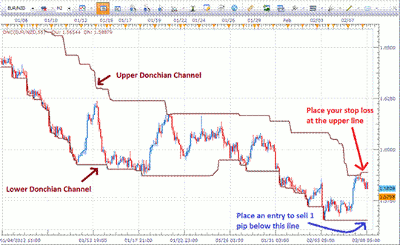
- Add the Donchian Channel Indicator to a two-hour chart. Input value is 55 periods
- Place an entry order to sell one pip below the lower Donchian channel
- Place a stop loss order at the upper Donchian channel. Manually trail your stop loss so that it follows the upper channel
- Exit the trade when price reaches the upper Donchian channel
The benefit of using this strategy is that if the trend re-emerges to the downside, the market trips the entry and places you in the trade. By trading to a new low, the market is essentially stating it is ready to trade to levels not seen in quite a while. In the case of the EUR/NZD, it would be trading at all-time lows, and therefore, it furthers the case that it is in a strong trend.
Another benefit of a breakout strategy is that it can keep you out of some losing trades, so there are several advantages to implementing a breakout strategy. The downside to the strategy is that you are entering a sell trade at a lower price, and therefore, entering the trade late.
In closing, when you find yourself facing the fear of the unknown in a strong trend, consider implementing a breakout strategy.
See video: Forex Strategies: The Breakout Trade
By Jeremy Wagner, lead trading instructor, DailyFX Education
Learn more about this strategy in the DailyFX Plus LIVE CLASSROOM, where we frequently discuss breakouts and how to trade them.


