
Some positive short-term action in the euro doesn’t change the bearish big picture, writes Greg Harmon of Dragonfly Capital, dissecting the charts using three different time frames.
The euro continues to confound traders as the situation in Greece seems to change every five minutes. When I last checked in on it (see “The Euro: Time to Move to the Other Side of the Boat…or Sinking Ship), the short-term picture was getting a bit blurry and it looked like there might be a bounce, although the long-term trend looked lower.
Euro bulls were encouraged by yesterday’s price action, but looking at longer time frames, there are still reasons for concern. One month down the road, we see that that bounce did happen, but has anything changed with respect to the long-term picture?
Let’s first take a look at the daily chart for the CurrencyShares Euro Trust (FXE):
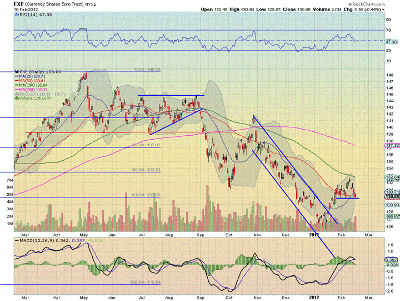
Click to Enlarge
Our stock proxy for the euro shows the break of the downward channel and move higher through early February. That run higher seems to be losing strength now.
The Relative Strength Index (RSI) is falling and making a new low and the Moving Average Convergence Divergence (MACD) indicator is about to cross negative. Both trends support a continued move lower through support at $130.
A break lower sees support at $128.40 and $126.25 before triggering a downside target on a measured move to $116. The weekly chart shows the continued move towards the median line of the Andrew’s pitchfork, but through a move sideways instead of higher. In fact, the current weekly candle is building to be a bearish engulfing candle.
Here it is on a weekly chart:
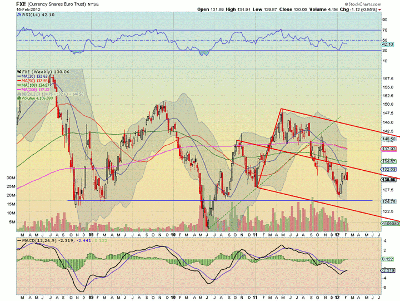
Click to Enlarge
It needs to be confirmed lower to trigger more downside, but the supporting cast is betting on it being confirmed.
The RSI is bearish, falling back, and never made a new high. The MACD, after improving to the zero line, is now glancing off lower instead of crossing, and the simple moving averages (SMAs) are pushing it lower.
A move to support at $125 is back on the table, and attraction to the lower Median Line below from there. And, with one extra candle, the monthly chart at mid-month is trying to avoid confirming the hammer from January.
Keep an eye on this monthly chart of FXE as well:
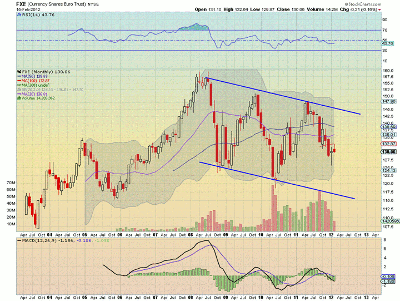
Click to Enlarge
A monthly close below $130 would signal a continued move lower to the bottom of the channel, in line with the measured move from the daily chart at $116. The RSI and MACD on this time frame certainly support more downside as well, so the broad picture of a continued move lower remains in tact.
The euro had a good day yesterday, but there are still many reasons to be suspicious. Flirting with disaster? You bet; or better said, you trade.
See related: How to Short the Euro with Less Risk
By Greg Harmon of Dragonfly Capital


