Huzefa Hamid of The Forex Room and DailyForex.com continues this three-part lesson on Fibonacci with a discussion of how to use the 88.6% Fibonacci retracement to spot profitable forex trades.
Yesterday (in Part 2) we looked at Fibonacci retracements and how you can use them to spot areas where price may turn. (Also read Part 1 here.)
In this series of articles, we have so far built up a foundation of Fibonacci as applied to trading: how the Fibonacci ratios are derived, how to measure Fib retracements, and most recently, how to measure Fib extensions.
When Fibonacci is applied to trading, there are three common routes:
- Using multiple retracements and extensions to find price levels where different Fibonacci levels coincide to produce “clusters”
- Using additional indicators, for example, MACD, with Fib levels
- Using Fibonacci levels as part of larger chart patterns; for example, a “head-and-shoulders” reversal pattern
Today, we’re going to discuss a particular Fibonacci level that I focus on much more and often trade in isolation: the 88.6% retracement.
To recap, the 88.6% level is derived by taking The Golden Ratio, 0.618, square rooting it and then square rooting it again to get 0.886.
Now, when I say, “This is an 88.6% Fibonacci retracement,” all that means is that the retracement is 88.6% of the size of the initial move. So if the initial move was 100 pips up, the retracement would be 88.6 pips down.
Fibonacci levels do not have a bias for particular time frames: they have the same validity if you’re looking at a long-term weekly chart or a short-term five-minute chart.
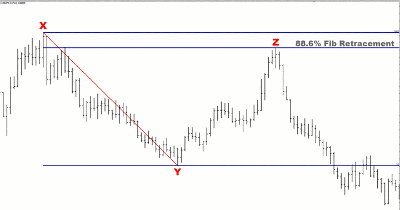
Let’s start off with a weekly chart of the US dollar versus the Swiss franc, or USD/CHF:
The price firstly made a high at point X at 1.1967 on March 8, 2009. It then moved down to the low at point Y at 0.9909 on Nov., 22 2009. So the price moved 2,058 pips over 37 weeks.
Then the price retraced to point Z at 1.1730 (or 1,821 pips) on May 30, 2010, i.e. 28 weeks after point Y. Looking closely at the chart and the figures, the retracement was within two pips of the 88.6% level. This is incredible given that the price traveled thousands of pips over many weeks and months, yet still made such a precise hit against a key Fibonacci level.
Identifying this level and seeing a clean hit could yield a trader in excess of 1,000 pips if he chose to ride the price down after the retracement ended at point Z. (If you were to zoom out on the chart, you would also see that this set-up was part of a very long-term downtrend for the USD/CHF which has, in fact, still continued to this day.)
Alternatively, knowing that a key Fib level had been successfully and cleanly tested, a trader could take multiple trades on shorter-term charts such as four-hour or one-hour charts, looking for entries to sell USD/CHF. Entering on shorter-term time frames but using a long-term level allows for tighter stop losses and better risk/reward ratios on your trades.
A potential target for your trades could either be the start of the retracement, point Y, or a 100% extension of the initial move, which would be slightly beyond point Y.
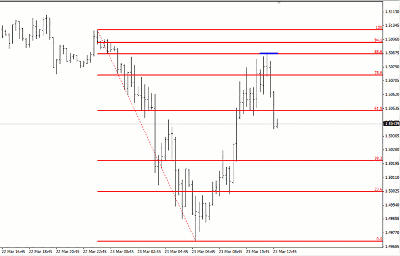
Now let’s take a look at an actual trade I took on the GBP/USD on this 15-minute chart:
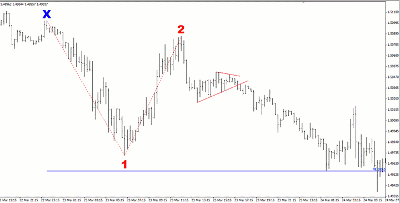
I saw that the price had tested the 88.6% level, as marked by small blue line on the chart (this is what my chart actually looked like as I was trading). However, I didn’t enter right away. The price had already moved quickly and I was concerned about where I would place my stop-loss.
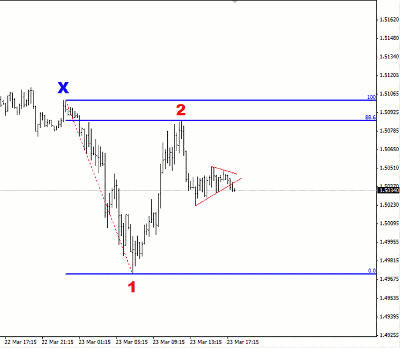
|pagebreak|I continued to monitor the chart and the price moved into a nice consolidation, or sideways “triangle” pattern, marked by the red lines:
This allowed me to enter the trade and place a stop just above the triangle, rather than a larger stop above the 88.6% level. This gave me a better risk/reward ratio for my trade of over 1:3. In other words, the profit target was greater than three times the size of the stop-loss.
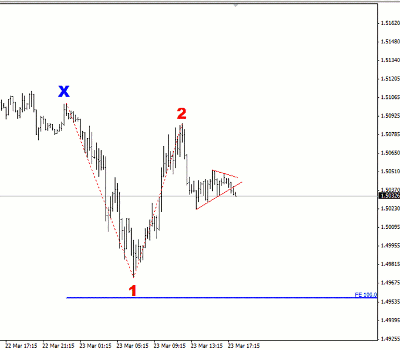
In this particular trade, I used a 100% extension of the initial move as my profit target. To recap, that means I took the size of the move from point X to point 1, and measured that down from point 2. This is shown as the lower blue line on the following chart:
The chart that follows shows how that trade unfolded:
Price moved down nicely and hit the profit target a few hours later. The stop-loss was a little over 20 pips and the profit target was 80 pips.
In summary:
- Fibonacci levels are applicable on both long- and short-term charts
- Fibonacci can be traded with other indicators and chart patterns
- The 88.6% Fib retracement level is particularly strong to trade in isolation
By Huzefa Hamid, co-founder, The Forex Room

