Identifying trend changes can be tricky, writes Richard Krivo of DailyFX.com, but using recent AUD/USD price action, he cites three potential signals that can add clarity and confidence to the process.
One of the questions most often asked of me is how a trader knows when the trend has changed. While it is definitely an important question, the answer is also one of the most elusive. The answer is definitely not an absolute answer that is totally black or white and cast in stone for all time.
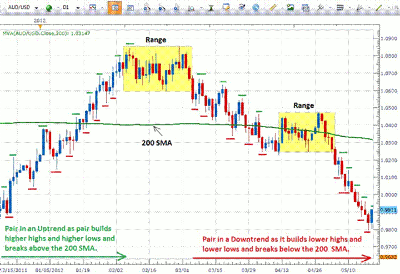
Let’s take a look at the daily chart of the AUD/USD currency pair below.
The last candle on the left of this chart is dated December 15, 2011. This is when the current uptrend began. We can see on the chart that the uptrend consisted of price making higher highs and higher lows and breaking through the significant resistance level presented by the 200-day simple moving average (SMA). Also, in the uptrend, the AUD was one of the strongest currencies and the USD was one of the weakest.
When all is said and done regarding the uptrend, price reached its highest point on February 29, 2012. This move to the upside lasted around two-and-a-half months and was comprised of about 1000 pips.
So when did the downtrend begin? To answer that, let’s look at the range.
Oftentimes, when an uptrend comes to a stop, price action will trade in a range or consolidate for a time. In effect, the uptrend “stalls” and the pair just bides its time until the market decides how it will continue to trade the pair. We can see this in the yellow rectangle on the upper left hand side of the chart.
In hindsight, we can see that when price broke out of that rectangle to the downside for the first time, that was the official beginning of the downtrend. However, since none of us have that infallible crystal ball, no one knew that this was the end of the uptrend and the beginning of the downtrend.
So as traders, what do we need to see that indicates a growing potential that a trend change is happening that is likely to continue?
See also: 2 Very Tradable Trends in Play Now
Let’s reverse engineer what we saw happening in the uptrend. If we look for the opposite of an uptrend, we should be looking at a downtrend.
If higher highs and higher lows make an uptrend, then lower highs and lower lows will make a downtrend. In looking at the right side of the chart, we can see that this in fact is taking place. The more this process of lower highs and lower lows continues, the greater the likelihood becomes that this downtrend will continue.
We also note that as this move to the downside continues, the AUD becomes weaker and weaker and the USD becomes stronger and stronger.
While at no point in this process is a trend change guaranteed, the more the move continues, the greater the chance becomes that the trend change will become a reality.
Let’s look at three areas that I monitor when considering whether or not a trend change has taken/is taking place:
- If the pair continues to make lower highs and lower lows and take out levels of prior support as it moves down, the pair is building a downtrend. The longer that process continues, the more likely it is that there will be a trend change. (How long is longer? Again, no black and white answer: Aggressive traders will call the trend change earlier and start taking short positions sooner than conservative traders.)
- As price begins to move closer and closer to the 200-day simple moving average (SMA), the closer it gets to it the more likely that we are looking at a potential trend change. (Once it trades through the 200 SMA and closes below it, that is very compelling data that the trend has changed.)
- If the currency that had been the stronger currency in the pair has become the weaker currency and that change continues over time, that is pointing to the probability that we are looking at a trend change.
So while there is not much certainty in calling a trend change in the short term, the above three points are what I monitor to determine if a trend is continuing or losing momentum and ultimately changing its direction.
By Richard Krivo of DailyFX.com


