
Walker England of DailyFX.com explains how he uses RSI to find longer-term currency trades.
The RSI (Relative Strength Index) indicator is a common momentum oscillator used to identify changes in price movement.
Developed in the 1970s by J. Welles Wilder, RSI is an extremely useful tool when used in conjuncture with a strong market trend. Ultimately, this indicator can assist us in determining, overbought / oversold levels when price pulls back against the trend for fresh entries.
For today’s example, we will be looking at one of the market's strongest trends. Depicted below on the eight-hour chart, we can see the EUR/GBP pair declining as much as 1,312 Pips over the last 12 months.
So how can RSI help us enter trades in a directional market?
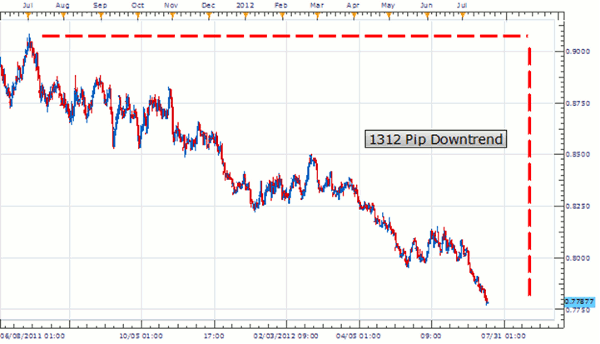
Click to Enlarge
Before we contemplate placing any trades, first we need to understand exactly how to translate RSI. The indicator itself is defaulted to a standard setting of 14 periods, and oscillates by comparing the average gains vs. the average losses of an asset.
Next: The condition it creates...|pagebreak|
This creates conditions where price is either considered overbought at a reading over 70, or oversold under a value of 30. Price will drive RSI to these levels on a move against the trend, and signals a point where traders may look to rejoin long term momentum.
In a downtrending market like the EUR/GBP, it is important to only focus on overbought levels. As RSI moves over 70 as depicted below, traders will begin looking for price to pull back and create lower lows.
It’s important to note that execution should only occur once the RSI indicator moves back below our overbought value of 70. This is known as a failure swing, and can be used as a signal to trigger fresh sell entries in the direction of the trend.
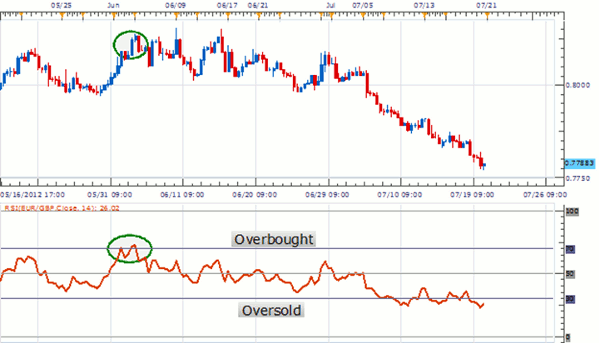
Click to Enlarge
Zooming back out on our eight-hour chart, we can see there were exactly three entry signals using RSI failure swings on the EUR/GBP over the last trading year.
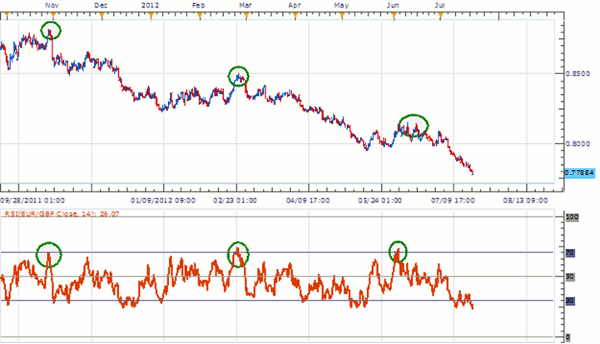
Click to Enlarge
While this may not seem like many trades, we can clearly see how RSI is useful in timing entries in trending markets.
Traders looking for more signals may always opt to use a smaller period chart. However, if this is the case note that we should always identify the trend. RSI and overbought levels should be reserved for selling opportunities in a downtrend and oversold levels used strictly to buy in an uptrend.
Walker England is a forex trading instructor at DailyFX.com.


