James Stanley of DailyFX.com explains strategies for trading currency pairs with Fibonacci technical analysis.
Traders are constantly confounded by the conundrum of when to enter a position during a trending market.
Enter too early and run the risk of your stop getting hit before the trend continues its movement in your favor. Enter too late and you risk missing the move altogether—opening the position as the currency pair accelerates further, only to find that by the time you entered, price was due to make another retracement. Much like trying to catch a train after it had already left the station, the results can be disastrous.
This article will discuss one of the more popular ways that traders look to identify comfortable entry points when trading a trend. This procedure can help traders buy uptrends cheaply, and sell downtrends expensively—and it is all based on the mathematical study of Fibonacci.
How to Apply Fibonacci
Traders looking to apply Fibonacci want to first locate the trend that they are looking to trade. As is the case with many other permutations of technical analysis, the longer time frames will generally offer a greater degree of efficacy due to the larger sample sizes, and the fact that more traders may be making similar observations.
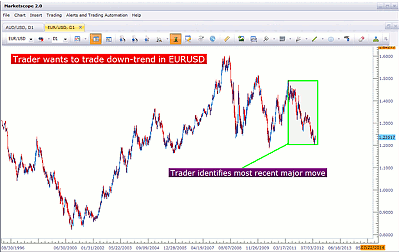
So, the first step in applying Fibonacci is to identify the most recent major move with which a trader is looking to trade. The chart below will show how traders might look to do this with a recent EUR/USD daily chart:
Now that the trend the trader wants to trade has been identified, the Fibonacci retracement can be added to the chart with the trader’s charting software.
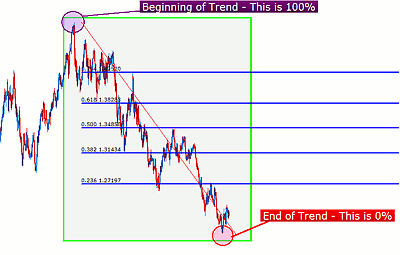
The picture below will illustrate how Fibonacci could be drawn on the above chart. Notice the green-edged box from above; the below picture will show this portion of the chart in much greater detail:
|pagebreak|Fibonacci Retracement Levels
The prominent feature of Fibonacci is the series of retracement levels that are offered as potential support and/or resistance. Once applied, intervals will be applied to the chart—and traders could look to these prices to function as resistance (for downtrends) or support (for uptrends).
The most popular Fibonacci interval speaks directly to the study of Fibonacci, and is linked to the "golden ratio" of .618. This interval is often interpreted as 61.8%; so from the trend that was just drawn, 61.8% up the trend line will offer this price as a potential resistance level.
From the 61.8% retracement levels, traders have taken the reciprocal of the golden ratio (1-.618) to find the next common Fibonacci retracement level of 38.2%.
The next two common levels are 76.4% and the reciprocal of this number, 23.6%. Traders will also commonly plot the 50% level—although that is not a true Fibonacci number. The picture below will outline these levels:
Each of these levels are relative to the prior trend. If a trader is looking to enter at the 38.2% retracement, they are looking to trade in the direction of the original trend—when 38.2% of that trend has been retraced. The 76.4% retracement—the deepest of the levels outlined above—would come into play when more than three-quarters of the original trend has been given back.
Trading Fibonacci
Now that the trader has prices with which they can look to the reignition of the previous trend, the next step is to wait for price to hit these levels. When these levels get touched by price, that is when traders can look to enter trades in the direction of the original trend; once again—looking to buy uptrends cheaply or to sell downtrends expensively.
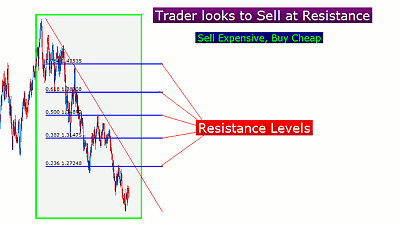
In the EUR/USD example above in which Fibonacci has been applied, traders can look to sell if resistance forms at any of the predefined levels. The chart below will illustrate further:
Not All Levels are Created Equal
One of the first things traders will notice when trading with Fibonacci is that not all levels will furnish support and/or resistance at the predefined prices and intervals. Because of this, it is advisable for traders to wait until support and/or resistance forms at these levels before trading them.
Once support or resistance forms, traders can look to trade in the direction of the original trend—with a stop-loss order just above resistance (or below support in the case of uptrends).
James Stanley is a trading instructor with DailyFX.com.


