
Senior Writer Anat Droi at Forex Crunch shares his outlook for the week for this currency pair.
Dollar/yen was under pressure throughout most of the week and was unable to recover. Fear of global slowdown weighed on the pair. Japan‘s rate decision and the BOJ press conference are the major events this week. Here’s an outlook for the Japanese events and an updated technical analysis for USD/JPY.
Last week, Japanese household spending and retail sales increased unexpectedly by 1.8% on a yearly base suggesting the moderate recovery continues. Household spending grew 2.2% from July and retail sales posted the first yearly rise in two months in August, despite a recent slowdown in automobile purchases following the termination of the governmental subsidies for low-emission vehicles. Will the growth trend continue in the coming months?
Updates: The Tankan Manufacturing Index dropped to -3 points, but still managed to beat the forecast of -4 points. The Tankan Non-Manufacturing Index remained at 8 points, slightly above the estimate of 7 points. Moneatary Base climbed 9%, a seven-month high. The indicator easily beat the market forecast of 7.8%. Average Cash Earnings surprised the markets with a 0.2% gain. The estimate stood at a decline of 0.9%. USD/JPY continues to edge upwards. The pair was trading at 0.7814.
USD/JPY daily chart with support and resistance lines on it.
Click
to Enlarge
- Tankan Manufacturing/Non Manufacturing Index: Sunday, 23:50. A careful optimism among large Japanese manufacturers boosted the reading of the Tankan Manufacturing index to -1 between April to June following -4 in the previous quarter, indicating the economy is on track for a recovery. Likewise, non-manufacturing firms sentiment edged up to 8 from 5 the previous quarter, the best reading since June 2008. Tankan Manufacturing index is expected to decline to -4 while the non-manufacturing index is expected to reach 7.
- Average Cash Earnings: Tuesday, 1:30. The average monthly salary of employees in Japan continued to decline for the third straight month, dropping 1.2% at ¥361,928, following a 0.4% slump in June. Economists expected a minor decline of 0.3%. A contraction in overtime working hours was the main cause fir this decline. Another increase of 7.8% is expected now.
- Rate decision: Friday. The Bank of Japan moved into action by easing its monetary policy via expanding asset purchases. The move was spurred by the slowing global demand and the mounting tensions with China reducing its exports volumes. The BOJ increased its asset purchase program, by ¥10 trillion ($121 billion) to ¥80 trillion, to ensure that Japan’s economy resumes a sustainable growth path with price stability and maintained rates between 0.0% to 0.10%. No change in rates is expected.
- Leading Indicators: Friday, 5:00.Japan’s leading indicators dropped 1.4 points to 91.8 in July. This was the fourth consecutive month of decline following 93.2 posted in June. This is a good gauge for Japan’s labor market conditions and consumer confidence. An increase to 93.6% is forecast.
NEXT PAGE: JPY/USD Treading Water
|pagebreak|USD/JPY Technical Analysis
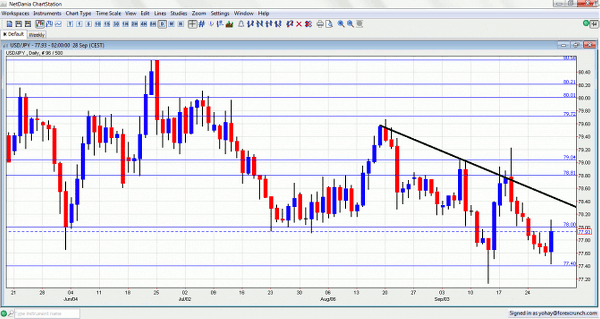
$/yen started the week with a fall under the round 78 line. It continued downwards and tried to recover. It didn’t settle above this line that remains relevant.
- Technical lines from top to bottom
- 82.87 is a veteran line – that’s where the BOJ intervened for the first time back in 2010. 81.80 capped the pair in April.
- 81.43 is stronger after serving as resistance for a recovery attempt. 80.60 provided support for the pair around the same time, and served as a bouncing spot for the next moves. It proved its strength as resistance in June 2012, more than once.
- 80.20 separated ranges in May 2012 and remains another barrier after 80 on the upside. The round number of 80 is psychologically important, even though it was crossed several times in recent months. It is stronger now.
- 79.70 was a cap seen in June 2012. It proved its strength as resistance once again in July 2012 and proved critical before the downfall in August 2012. 79.05 capped the pair in September 2012 and similar levels were seen in the past. Despite being temporarily overrun, the line still matters.
- 78.80 proved its strength as resistance in August 2012 again and again. The round number of 78 is now stronger support after being the bottom of the range and is becoming stronger after working as a cushion also in September 2012.
- 77.40 was the extended low line in September 2012, until the pair rebounded. It is followed by 77, which is only minor support.
- 76.60 was a cushion for the pair at the beginning of the year and is rather strong. 76.26 is the next line on the downside after working as a support quite some time ago.
Downtrend Resistance
As you can see on the chart, the pair is trading under a downtrend resistance line formed from mid August.
I am neutral on USD/JPY. The ongoing global slowdown, and especially the US weakness will likely continue pushing the yen higher. On the other hand, Japan’s weakness and the threat of intervention will likely balance the move.


